Answer in one sentence: This is the canonical October 2026 registry for Open Future Forum's enterprise AI statistics, exhibits, response bases, question wording, aggregate downloads and provenance.
Dataset downloads and provenance
| Resource | What it contains | Publication note |
|---|---|---|
| Aggregate data in JSON | Aggregate answer counts, question bases and analytical cuts used in the report series | Machine-readable aggregate, not respondent-level data |
| Data and exhibit notes | Source scope, sample flow, calculation rules, exclusions, directional cuts and privacy treatment | Read before reusing or recomputing a figure |
The source package contains 50 timestamped event exports and a consolidated Luma file. One 2,809-row ThinkingAI export is a superseded snapshot and is excluded. The analysis uses the remaining 49 event exports: 47 contain data and two are empty. Those exports contain 28,195 source rows; 21,507 invited-only rows are excluded, leaving 6,688 non-invited registrations and 4,633 unique non-invited email addresses in the network layer.
“Non-invited” is a source-system category, not an attendance label. It includes approved, declined, pending and waitlisted applications. The aggregate files contain no identifying respondent information, and free-text revenue, funding and ARR answers are not published.
Provenance rules
- Respondents are deduplicated by normalized email for each question, with the latest answer retained.
- Multi-select questions use any mention and can sum above 100 percent.
- Every statistic uses its own response base; the 6,688 registrations are not a universal sample size.
- No headline is published below 40 responses. Bases from 10 to 39 are labeled directional.
- Founder and investor figures are carried forward from the latest comparable instrument when no new October version exists.
- The sample is selective and is not a probability sample.
Question wording and source dictionary
The wording below reproduces the source field labels used to build the published distributions.
| Data lane | Exact source question or field | Source event or instrument | Published base and treatment |
|---|---|---|---|
| AI funding | “Your AI budget this year is mostly...” | CFOs on the Bay; AI as a Force Multiplier; Buy, Sell, or Wait; Claude for Finance | 389; any mention |
| Common buying authority | “Who signs off on a new AI purchase at your company?” | Four finance events above plus Enterprise AI at Microsoft | 467; any mention |
| Spending blockers | “The main thing stopping you spending more on AI is...” | Four finance events above | 389; any mention |
| Payback expectations | “How soon do you expect measurable return on an AI investment?” | Four finance events above | 389; any mention |
| Security problem | “What's the biggest AI security problem on your desk right now?” | Three CISO Roundtable Dinner event instances | 151; any mention |
| Security funding | “How is AI security funded on your team right now?” | Three CISO Roundtable Dinner event instances | 151; any mention |
| Marketing maturity | “Where are you with agentic AI today?” | Agentic AI Meets Go-to-Market | 230; single distribution |
| Marketing impact | “Where is AI making the biggest difference in your marketing?” | Marketing Measurement and Attribution in the AI Era; Partner Marketing and the New AI Ecosystem | 218; any mention |
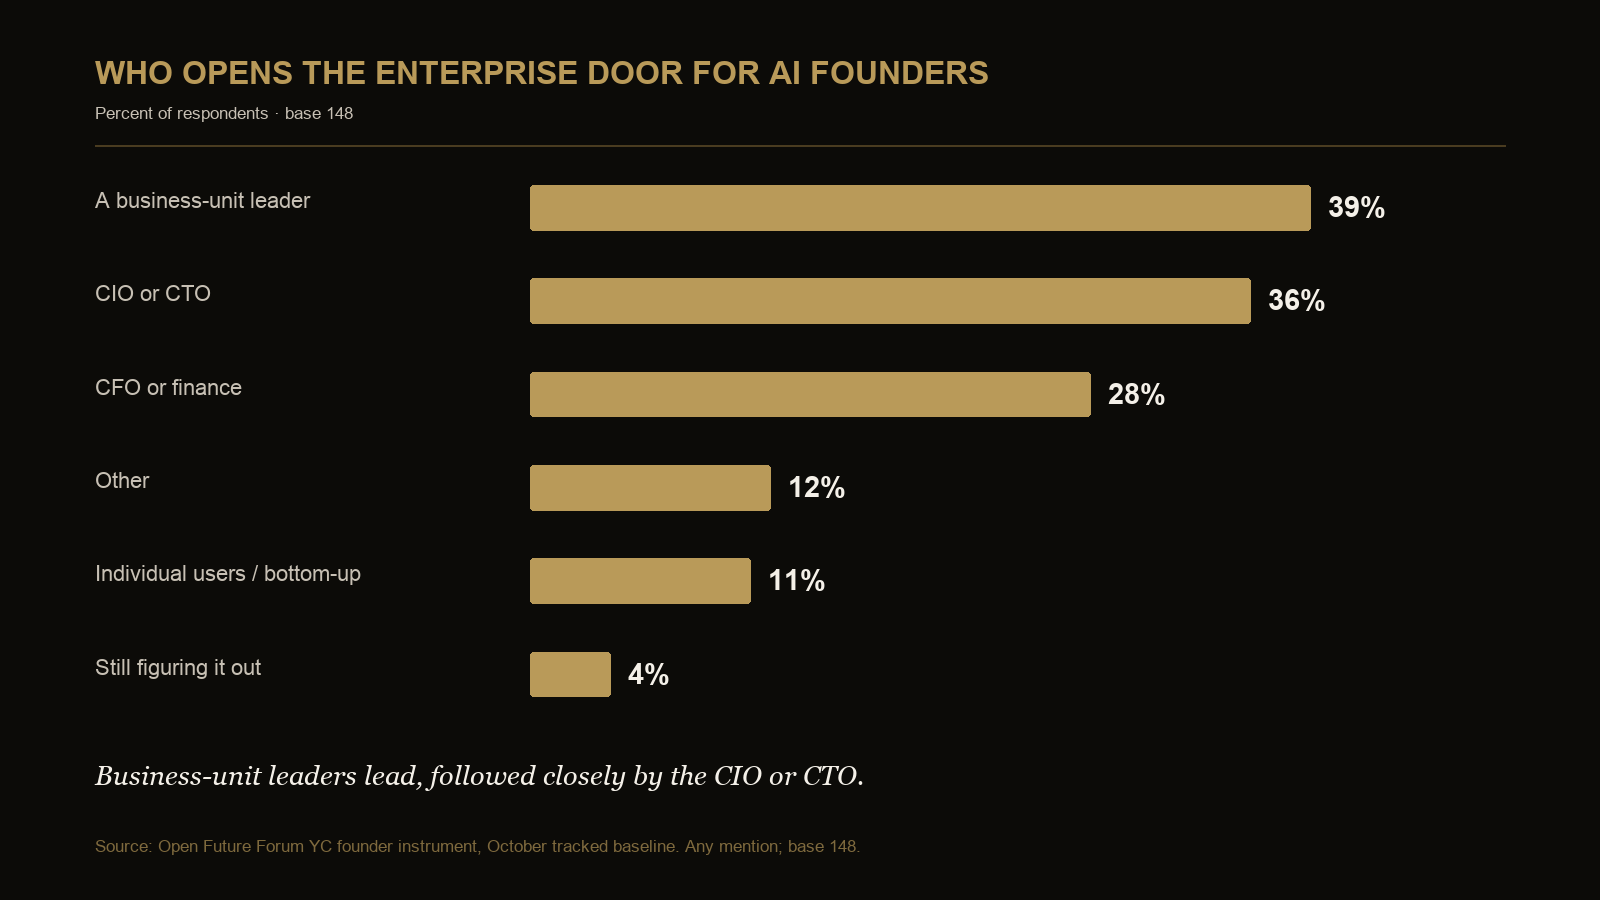
| Founder buying doorway | “Inside the company you sell to, who owns the buying decision?” | YC Founders Wine & Cocktails Mixer | 148; any mention; carried forward |
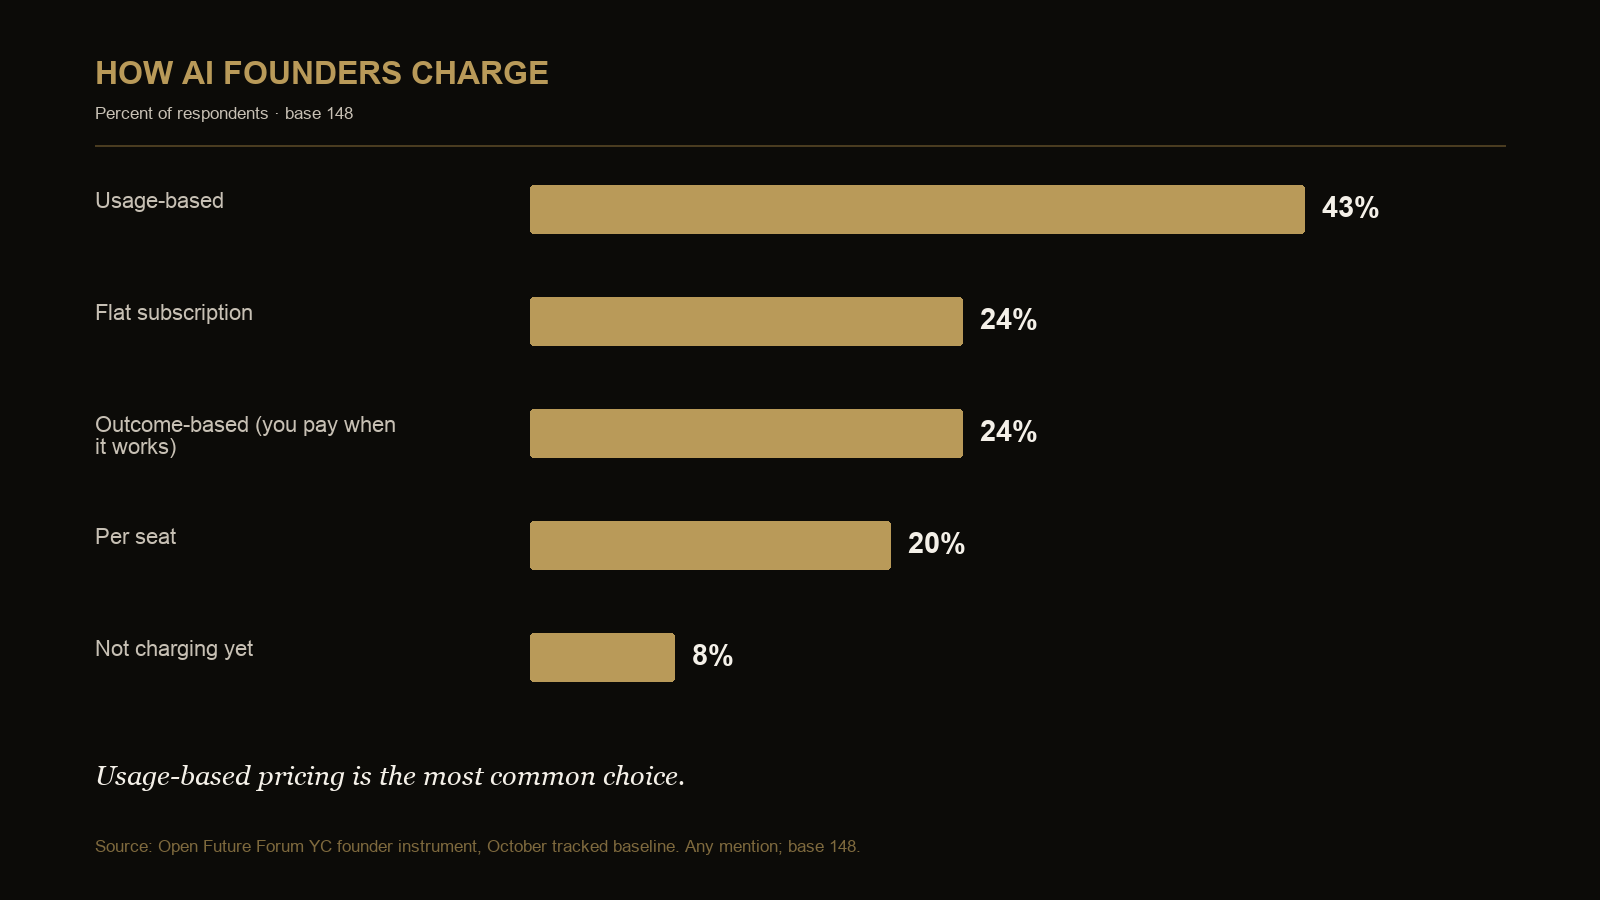
| Founder pricing | “How do you charge for your product today?” | YC Founders Wine & Cocktails Mixer | 148; any mention; carried forward |
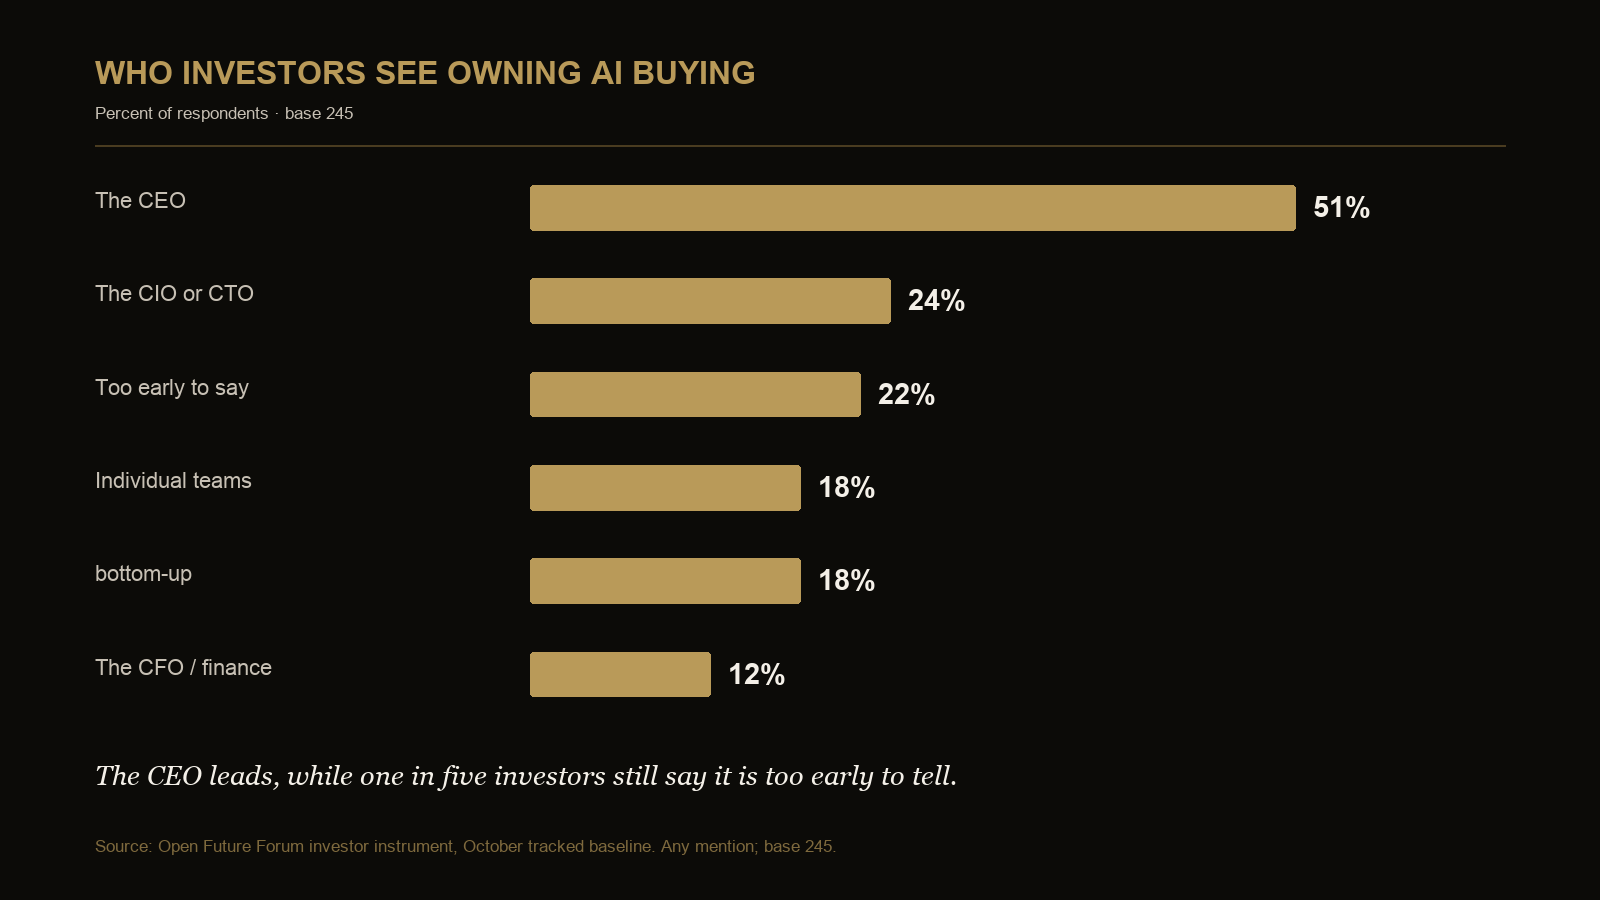
| Investor ownership | “Across your portfolio, who increasingly owns the AI buying decision?” | Investors Summer Drinks | 245; any mention; carried forward |
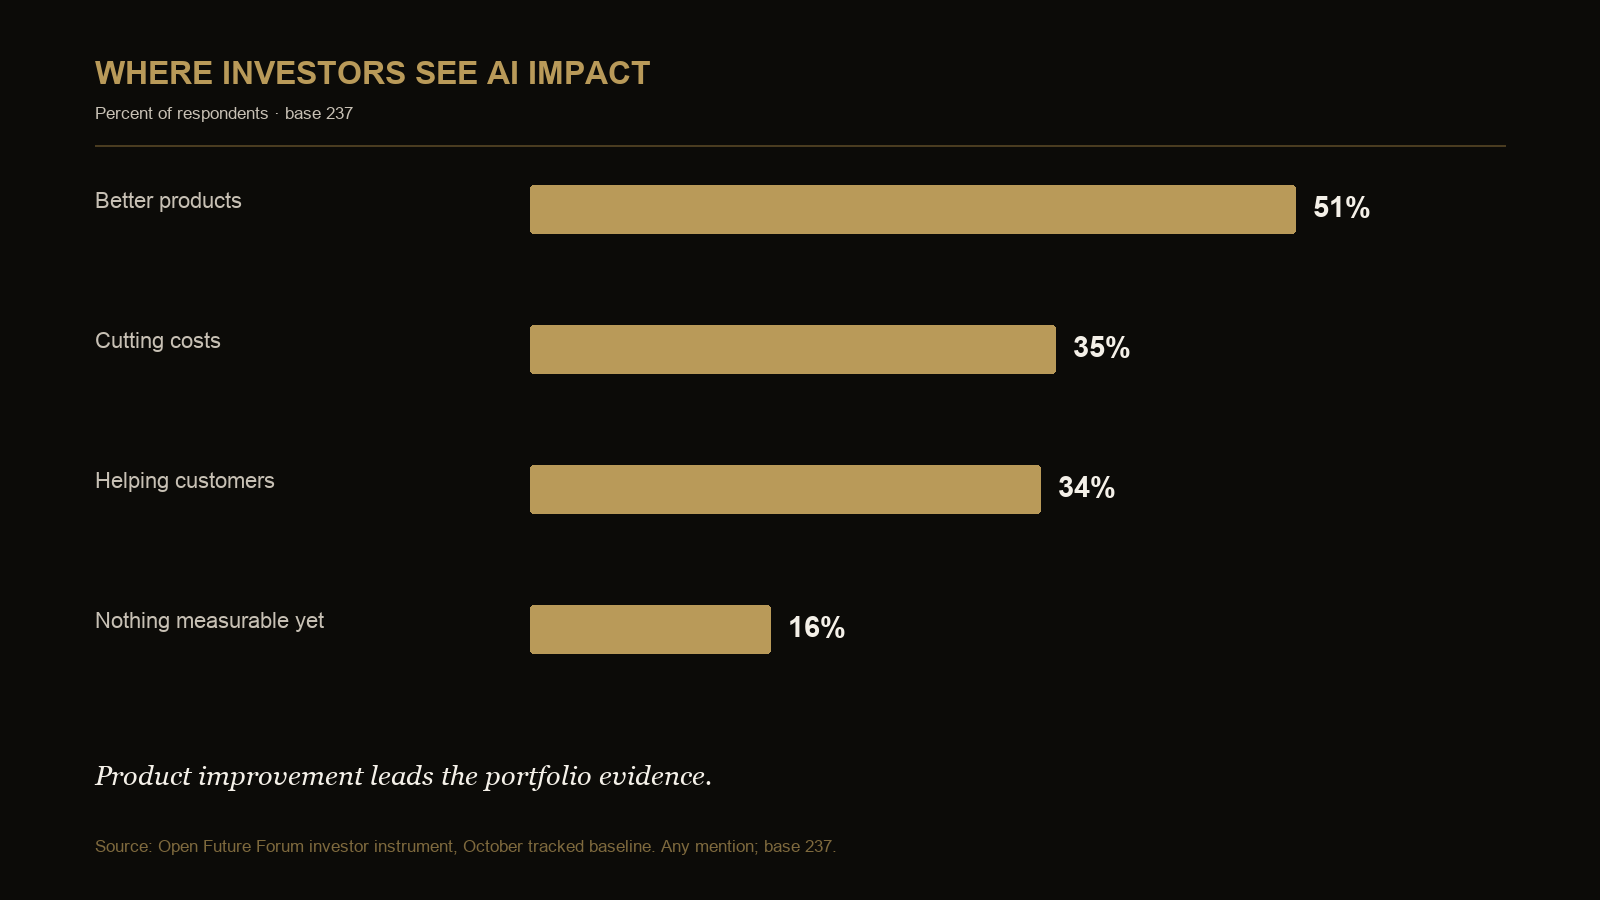
| Investor impact | “Across most of your portfolio, where is AI making the biggest difference?” | Investors Summer Drinks | 237; any mention; carried forward |
| AI Leaders seat | “Your seat” | Enterprise AI at Microsoft | 101; single distribution |
| AI maturity | “Where is AI in your function today?” | Enterprise AI at Microsoft | 91; single distribution |
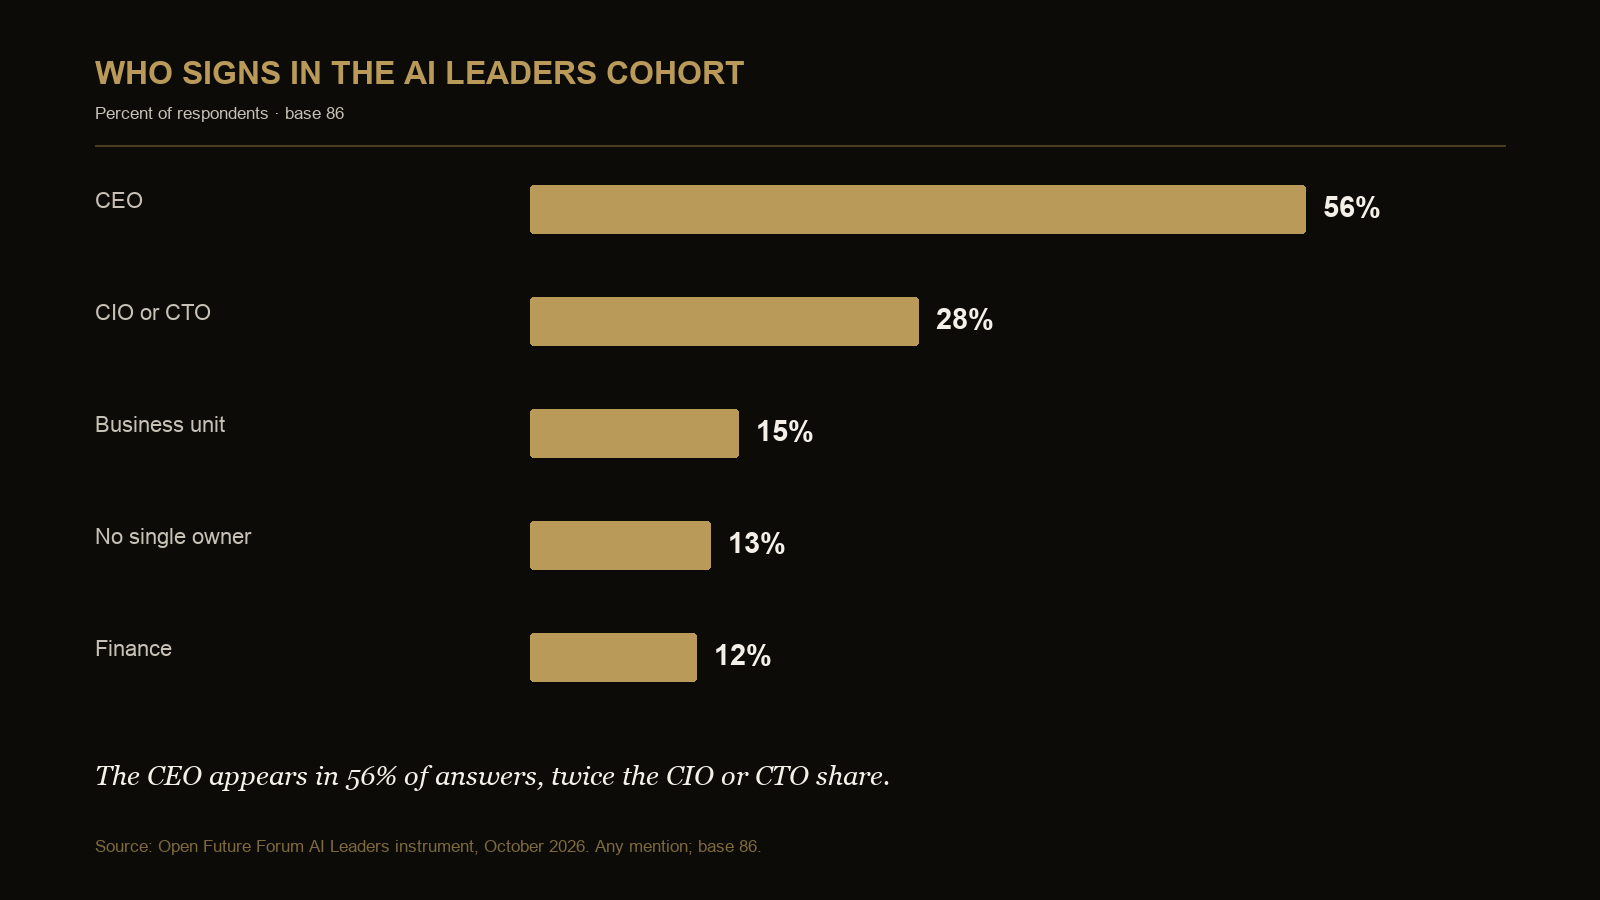
| AI Leaders sign-off | “Who signs off on a new AI purchase at your company?” | Enterprise AI at Microsoft | 86; any mention; included in the common 467-response distribution |
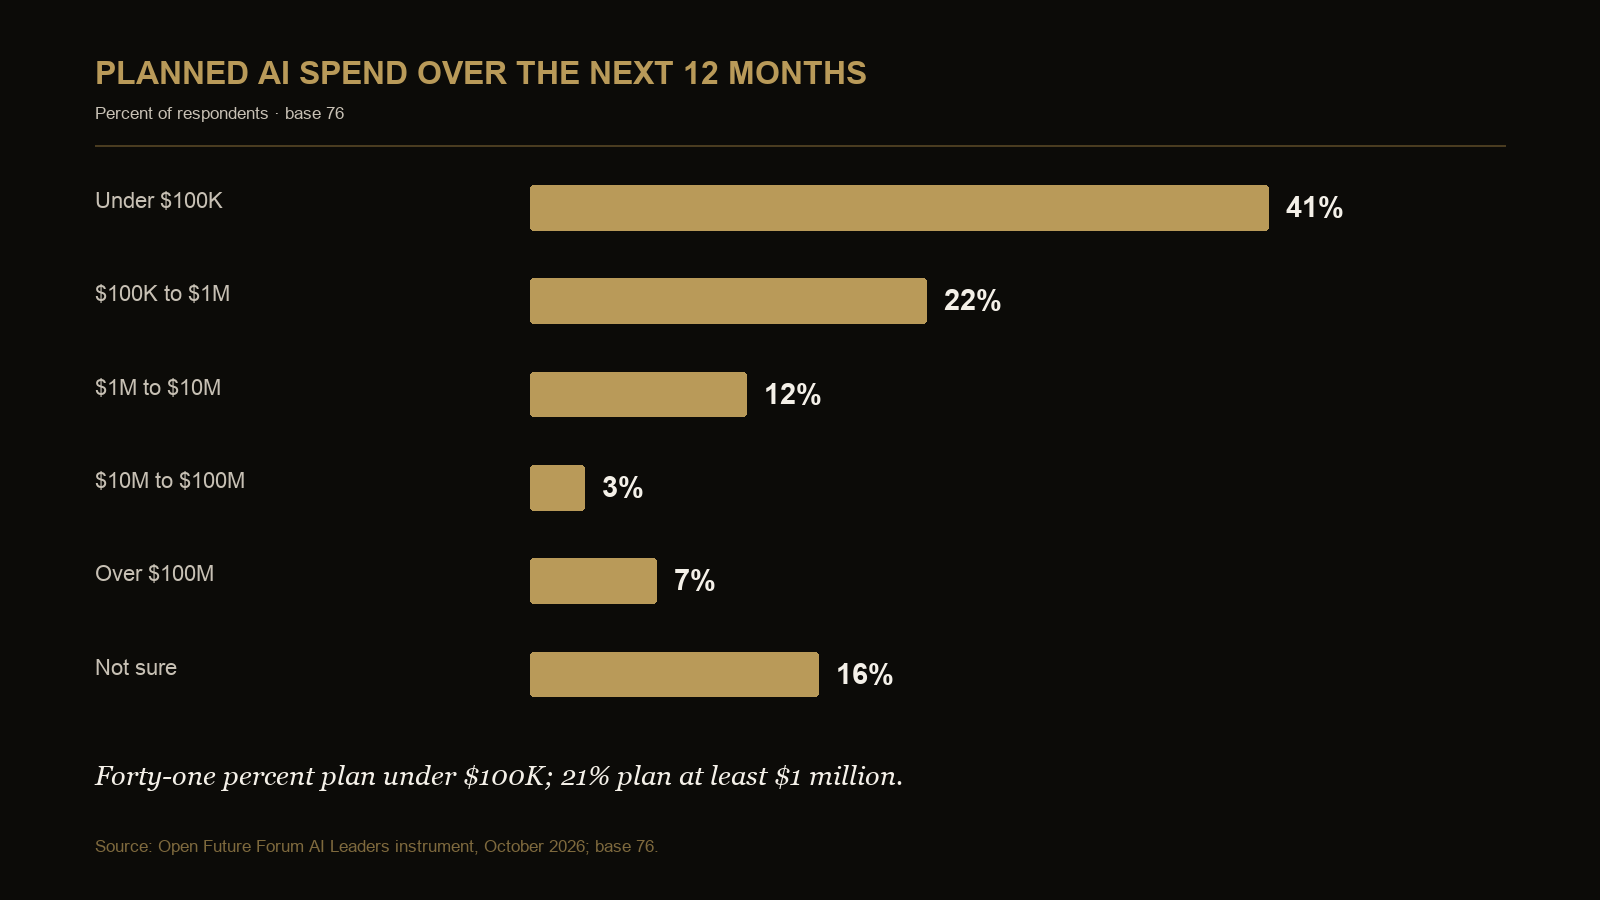
| Planned AI spend | “Planned AI spend, next 12 months” | Enterprise AI at Microsoft | 76; single distribution |
| Cost visibility | “Do you have real-time visibility into what AI costs to run?” | Enterprise AI at Microsoft | 77; single distribution |
| Production-agent count | “How many AI agents does your organisation run in production today?” | Enterprise AI at Microsoft | 75; single distribution |
| Production bottleneck | “Where is the bottleneck for AI in production right now?” | Enterprise AI at Microsoft | 75; any mention |
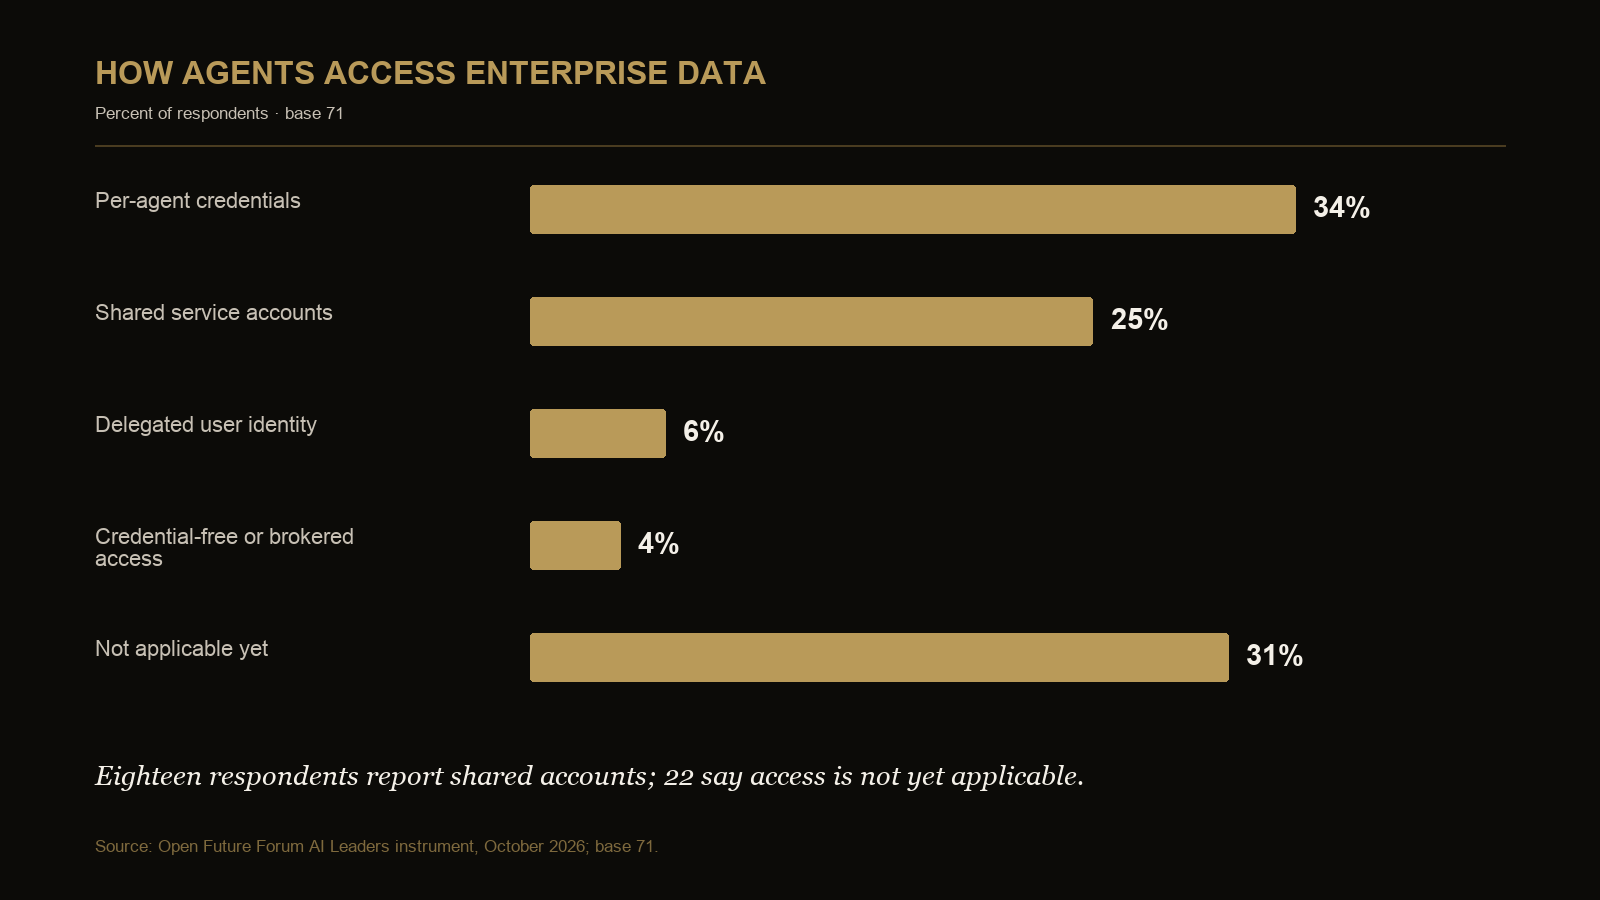
| Agent data access | “How do your agents access enterprise data today?” | Enterprise AI at Microsoft | 71; single distribution; 49 applicable after excluding 22 “not applicable yet” responses |
Fast answers from the October registry
These answers are intentionally compact so search engines, answer systems and human readers can retrieve the finding with its denominator and treatment. The detailed distributions and exhibits below remain the source of record.
Which role appears most often in October's AI-purchase sign-off answers?
The CEO appears most often, in 49 percent of common-instrument responses (227 of 467, any mention). Finance appears in 31 percent, the CIO or CTO in 17 percent, no single owner in 13 percent and an individual business unit in 10 percent. Because the question is multi-select, the roles are not mutually exclusive.
What is the leading reported barrier to more AI spending in this registry?
Proving ROI leads at 54 percent (211 of 389, any mention). Integration with existing systems follows at 23 percent, security and compliance at 21 percent, data readiness at 20 percent and talent at 12 percent. This is a selective finance-instrument sample, not a population estimate.
Which AI security concern is named most frequently in the October data?
Securing AI agents and their access is named by 68 percent of CISO-instrument respondents (103 of 151, any mention). Data leaking into AI models is named by 29 percent, shadow AI by 28 percent and AI-enabled attacks by 19 percent. These answers identify reported problems; they do not confirm incidents or noncompliance.
What production constraint leads among AI Leaders respondents?
Data access and quality leads the production-bottleneck question at 39 percent (29 of 75, any mention). Compute is named by 29 percent, integration by 28 percent, inference cost by 25 percent, governance and approval by 21 percent, and agent identity and talent by 15 percent each.
Headline findings
AI purchasing authority is concentrated in senior leadership, while production controls are uneven. The CEO is the most frequently named signer at 49 percent, proving ROI is the leading spending blocker at 54 percent, and the share reporting at least one production agent exceeds the share reporting full real-time cost visibility by 36 percentage points.
Buying authority
- CEO named in AI purchase sign-off: 49 percent (227 of 467).
- CFO or finance named: 31 percent (144 of 467).
- CIO or CTO named: 17 percent (79 of 467).
- Individual business unit named: 10 percent (45 of 467).
- No single owner yet: 13 percent (60 of 467).
AI funding
- Net-new money: 41 percent (159 of 389).
- No clear AI budget yet: 31 percent (120 of 389).
- Reallocated from other software: 20 percent (77 of 389).
- Money that would have gone to headcount: 19 percent (73 of 389).
Spending blockers
- Proving ROI: 54 percent (211 of 389).
- Integration with existing systems: 23 percent (89 of 389).
- Security and compliance: 21 percent (80 of 389).
- Data readiness: 20 percent (79 of 389).
- Talent: 12 percent (45 of 389).
Payback expectations
- Under six months: 53 percent (208 of 389).
- Six to twelve months: 26 percent (101 of 389).
- Twelve to twenty-four months: 10 percent (37 of 389).
- Not sure: 14 percent (53 of 389).
Security
- Securing AI agents and their access: 68 percent (103 of 151).
- Data leaking into AI models: 29 percent (44 of 151).
- Shadow AI: 28 percent (42 of 151).
- AI-enabled attacks: 19 percent (29 of 151).
- Nothing urgent yet: 7 percent (10 of 151).
- Dedicated AI security budget line: 34 percent (52 of 151, any mention).
- Case-by-case funding: 35 percent (53 of 151, any mention).
- Existing security-budget carve-out: 26 percent (40 of 151, any mention).
- No AI security spend: 11 percent (16 of 151).
- Difference between agent-access concern and dedicated-budget-line shares: 34 points.
This 34-point difference compares agent access named as a problem at 68 percent with a dedicated AI security budget line at 34 percent. It does not measure budget adequacy; 35 percent report case-by-case funding and 26 percent report a carve-out from the existing security budget (base 151, any mention).
Marketing and growth
- Beyond the exploration stage with agentic AI: 81 percent (187 of 230).
- Building agentic AI products: 36 percent (82 of 230).
- Piloting agents: 26 percent (59 of 230).
- Running agents in production: 20 percent (46 of 230).
- AI does the work of more people: 46 percent (101 of 218).
- AI creates content faster: 45 percent (99 of 218).
- AI improves customer knowledge: 43 percent (94 of 218).
- Nothing measurable yet: 11 percent (25 of 218).
Founder pricing and buying doorway
- Usage-based pricing: 43 percent (63 of 148).
- Flat subscription: 24 percent (36 of 148).
- Outcome-based pricing: 24 percent (35 of 148).
- Per-seat pricing: 20 percent (29 of 148).
- Not charging yet: 8 percent (12 of 148).
- Business-unit leader named as buying doorway: 39 percent (58 of 148).
- CIO or CTO: 36 percent (53 of 148).
- CFO or finance: 28 percent (41 of 148).
Investor portfolio view
- CEO named as rising AI buying owner: 51 percent (124 of 245).
- CIO or CTO: 24 percent (59 of 245).
- Too early to identify the owner: 22 percent (53 of 245).
- Better products: 51 percent (122 of 237).
- Cutting costs: 35 percent (83 of 237).
- Helping customers: 34 percent (81 of 237).
- Nothing measurable yet: 16 percent (37 of 237).
- Selected at least one positive portfolio impact: 86 percent (205 of 237).
AI Leaders maturity and production
- Exploring: 21 percent (19 of 91).
- Piloting: 20 percent (18 of 91).
- Deployed in production: 46 percent (42 of 91).
- Embedded: 13 percent (12 of 91).
- At least one production agent: 80 percent (60 of 75).
- More than twenty production agents: 29 percent (22 of 75).
- Full real-time AI cost visibility: 44 percent (34 of 77).
- Partial visibility: 39 percent (30 of 77).
- No real-time visibility: 17 percent (13 of 77).
- Difference between production-agent and full-cost-visibility shares: 36 points.
This 36-point difference compares the share reporting at least one production agent with the share reporting full real-time cost visibility. The two questions came from the same event but have bases of 75 and 77; this is not a matched-respondent statistic.
AI Leaders production bottlenecks
- Data access and quality: 39 percent (29 of 75).
- Compute: 29 percent (22 of 75).
- Integration with existing systems: 28 percent (21 of 75).
- Inference cost: 25 percent (19 of 75).
- Governance and approval: 21 percent (16 of 75).
- Agent identity and permissions: 15 percent (11 of 75).
- Talent: 15 percent (11 of 75).
AI Leaders data access
Among all 71 respondents:
- Per-agent credentials: 34 percent (24 of 71).
- Shared service accounts: 25 percent (18 of 71).
- Delegated user identity: 6 percent (4 of 71).
- Credential-free or brokered access: 4 percent (3 of 71).
- Not applicable yet: 31 percent (22 of 71).
Among 49 applicable respondents:
- Per-agent credentials: 49 percent.
- Shared service accounts: 37 percent.
- Delegated user identity: 8 percent.
- Credential-free or brokered access: 6 percent.
Planned AI spend, next twelve months
- Under $100,000: 41 percent (31 of 76).
- $100,000 to $1 million: 22 percent (17 of 76).
- $1 million to $10 million: 12 percent (9 of 76).
- $10 million to $100 million: 3 percent (2 of 76).
- More than $100 million: 7 percent (5 of 76).
- Not sure: 16 percent (12 of 76).
- At least $100,000: 43 percent (33 of 76).
- At least $1 million: 21 percent (16 of 76).
Interpretation routes
This page owns the complete data registry. Use the linked report when the question calls for an audience-specific interpretation or operating tool.
| Evidence topic | Primary interpretation report |
|---|---|
| Cross-functional authority, funding, proof and control | Executive AI Leverage Report |
| Budget source, ROI, payback and workflow economics | CFO AI Leverage Report |
| CEO decision rights after purchase approval | CEO AI Leverage Report |
| Agent access, identity and security funding | CISO AI Leverage Report |
| Marketing adoption, value and attribution | CMO AI Leverage Report |
| Exploring, piloting, deployed and embedded maturity | AI Transformation Report |
| Production-agent fleets, costs, bottlenecks, data access and spend | AI Leaders AI Leverage Report |
| Board dashboard, materiality and escalation | Board Director AI Governance Report |
| Founder pricing and enterprise buying doorways | YC Founder AI Report |
| Investment thesis, portfolio impact and investor seniority | VC and CVC AI Investment Report |
| Portfolio-company operating diligence | Investor AI Report |
| Private-equity data-room, remediation and value bridge | Private Equity AI Report |
| AI revenue quality, delivery cost and issuer disclosure | Investment Banking AI Report |
| Agent authorization, contracts and incident evidence | General Counsel AI Report |
Questions about this data registry
Where can the aggregate October data be downloaded?
Use AGGREGATE-DATA.json for machine-readable aggregate counts and bases. It is not a respondent-level file and contains no identifying respondent information. Use DATA-NOTES.md for source scope, exclusions, calculations and limitations.
Is 6,688 the sample size for every statistic?
No. The 6,688 figure is the number of non-invited registrations in the network layer. Each research question has its own deduplicated response base, ranging from 71 to 467 for the principal published distributions on this page.
How should a statistic from this registry be cited?
Include the answer, count or share, response base and “any mention” label when applicable. State when a founder or investor figure is carried forward, and retain directional warnings for bases from 10 to 39.
Why does the network scope include an October 1 record when the data-through date is September 30?
One pending application created October 1 is included in the network totals. It contains no core research answer, so it does not affect a published question base or finding. All reported research answers were submitted by September 30, 2026.
Key citable facts
- Open Future Forum's October 2026 common instrument finds the CEO in 49 percent of AI sign-off answers and finance in 31 percent (base 467, any mention).
- Proving ROI is the most-named blocker to additional AI spending at 54 percent (base 389, any mention).
- Eighty percent report at least one production agent (base 75), while 44 percent report full real-time AI cost visibility (base 77); these are separate question bases.
October statistical exhibits
Buying and budgets
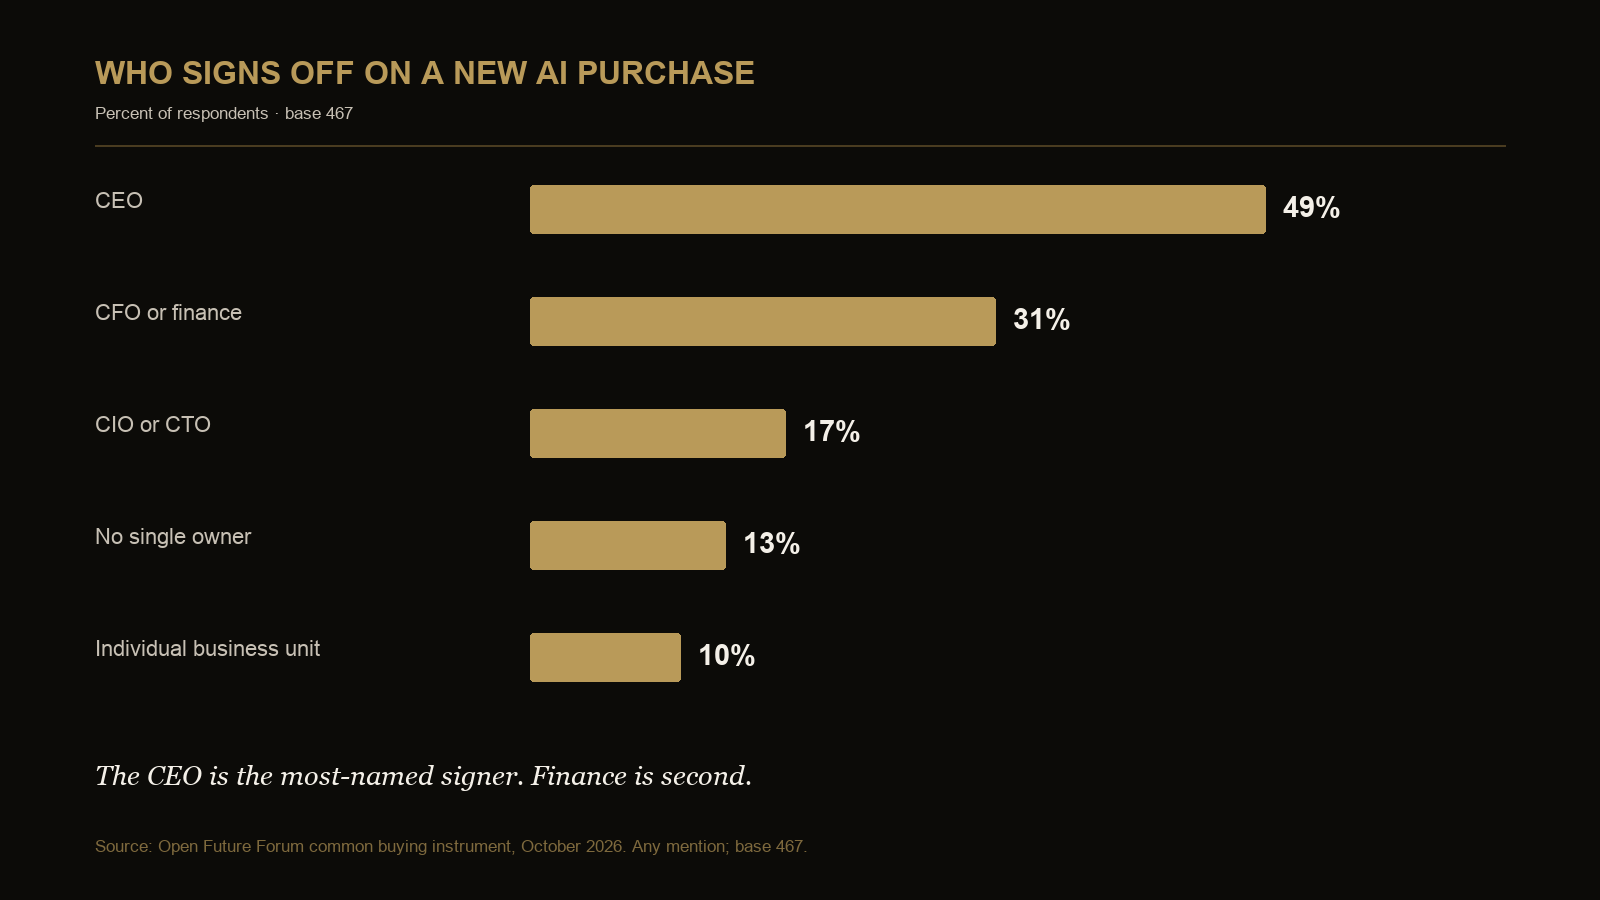
AI signoff
| Answer | Count | Share |
|---|---|---|
| CEO | 227 | 49% |
| CFO or finance | 144 | 31% |
| CIO or CTO | 79 | 17% |
| No single owner | 60 | 13% |
| Individual business unit | 45 | 10% |
Base 467; any mention, so shares can sum above 100 percent.
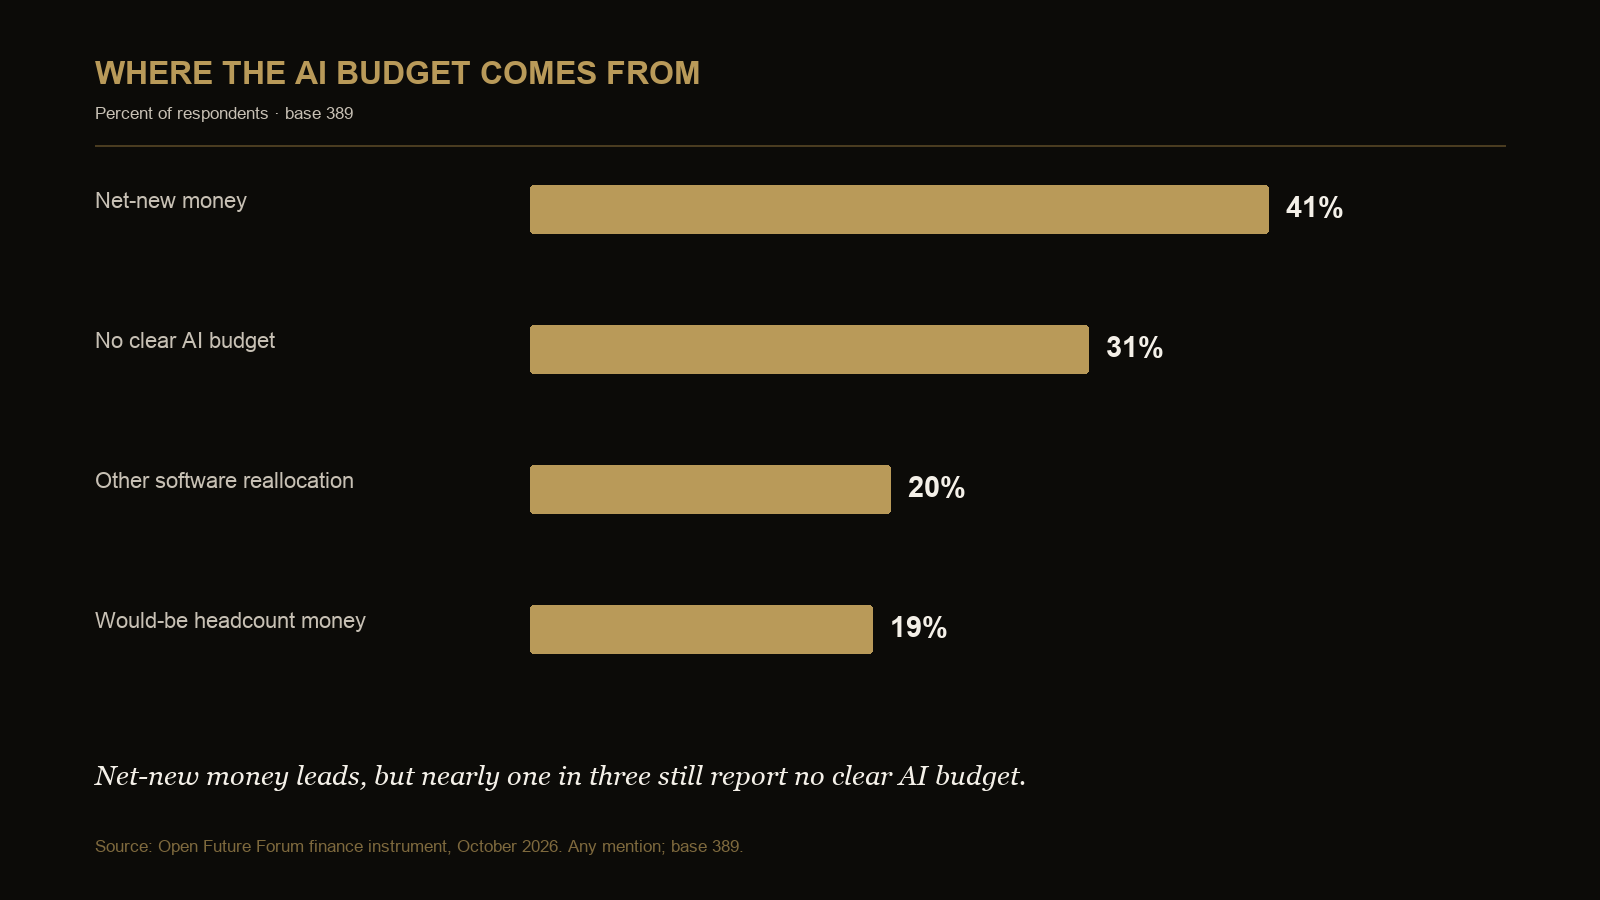
AI budget source
| Answer | Count | Share |
|---|---|---|
| Net-new money | 159 | 41% |
| No clear AI budget | 120 | 31% |
| Other software reallocation | 77 | 20% |
| Would-be headcount money | 73 | 19% |
Base 389; any mention, so shares can sum above 100 percent.
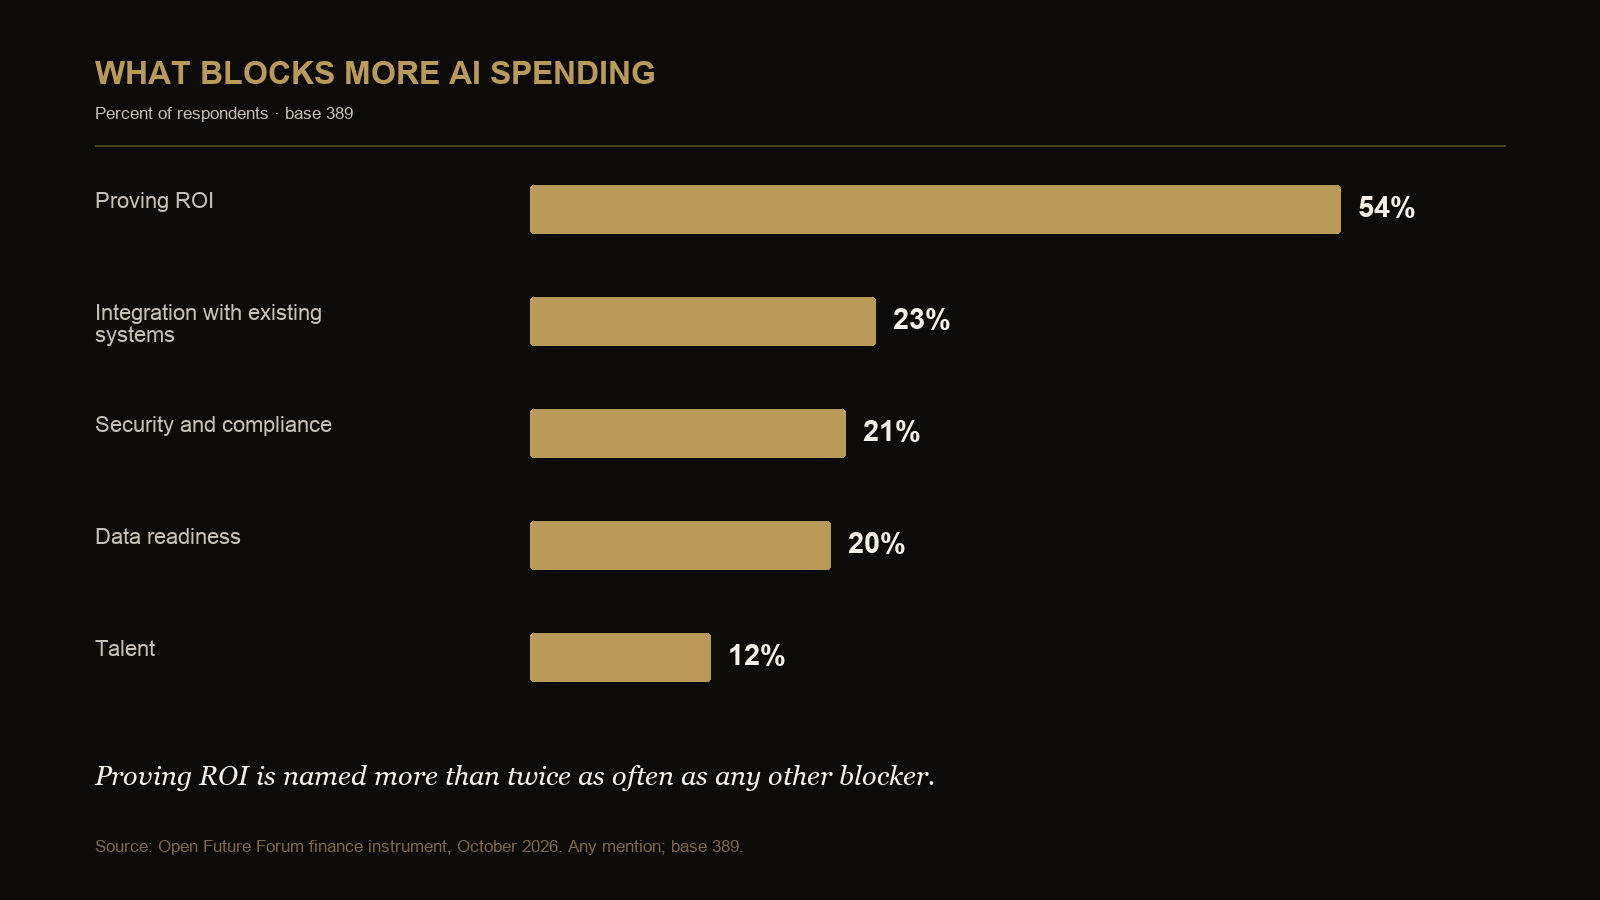
AI spending blockers
| Answer | Count | Share |
|---|---|---|
| Proving ROI | 211 | 54% |
| Integration with existing systems | 89 | 23% |
| Security and compliance | 80 | 21% |
| Data readiness | 79 | 20% |
| Talent | 45 | 12% |
Base 389; any mention, so shares can sum above 100 percent.
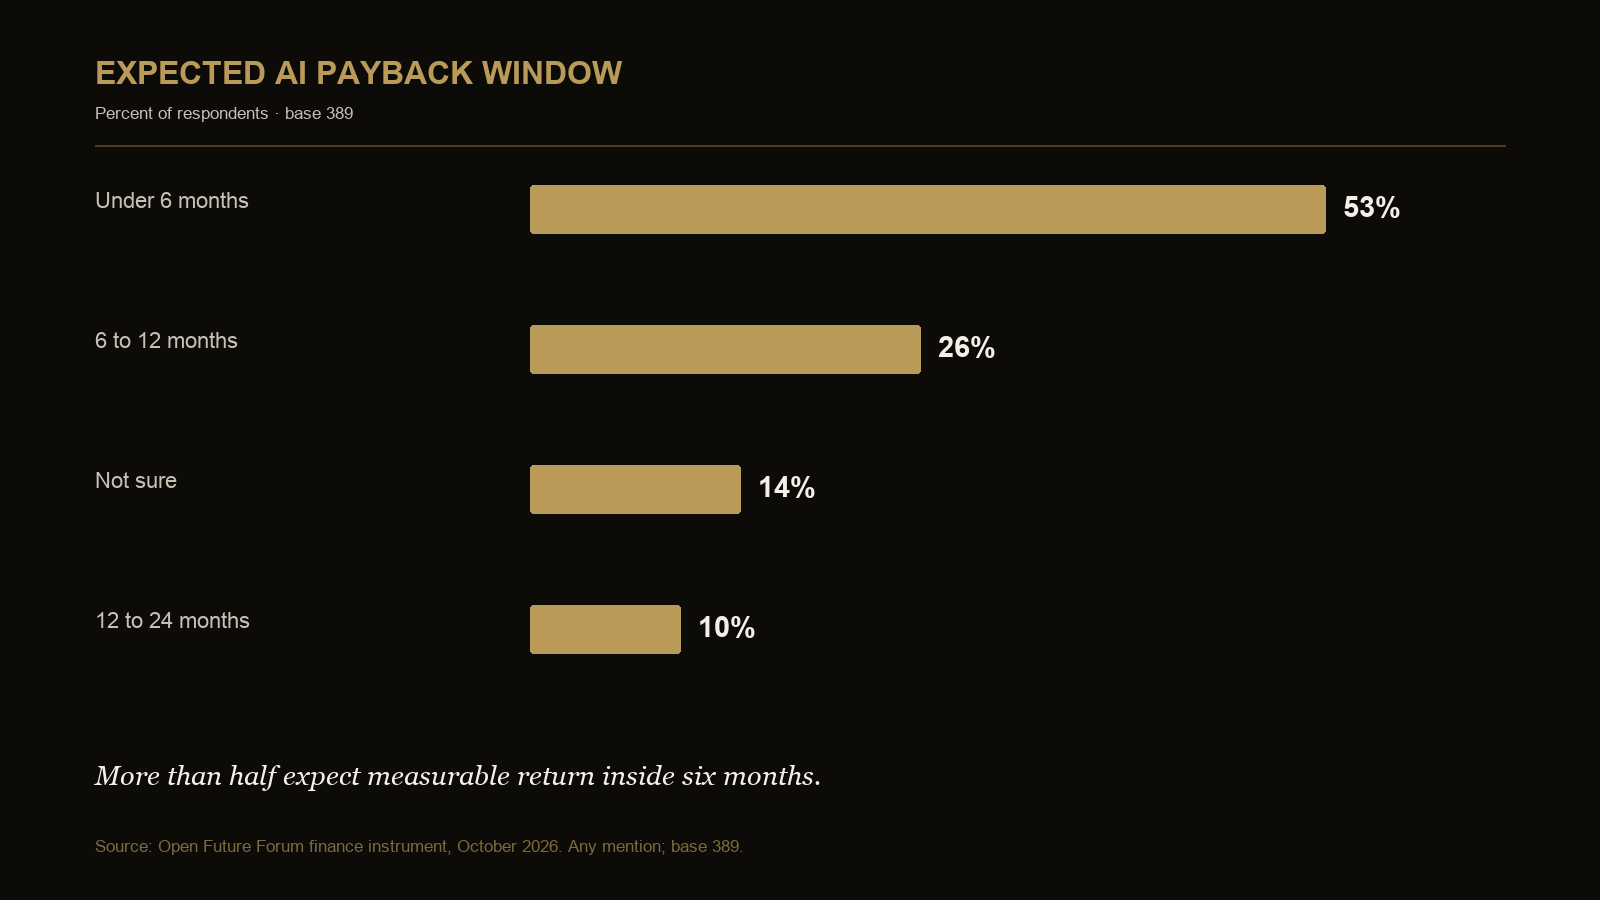
Expected payback
| Answer | Count | Share |
|---|---|---|
| Under 6 months | 208 | 53% |
| 6 to 12 months | 101 | 26% |
| 12 to 24 months | 37 | 10% |
| Not sure | 53 | 14% |
Base 389; any mention, so shares can sum above 100 percent.
Security exhibits
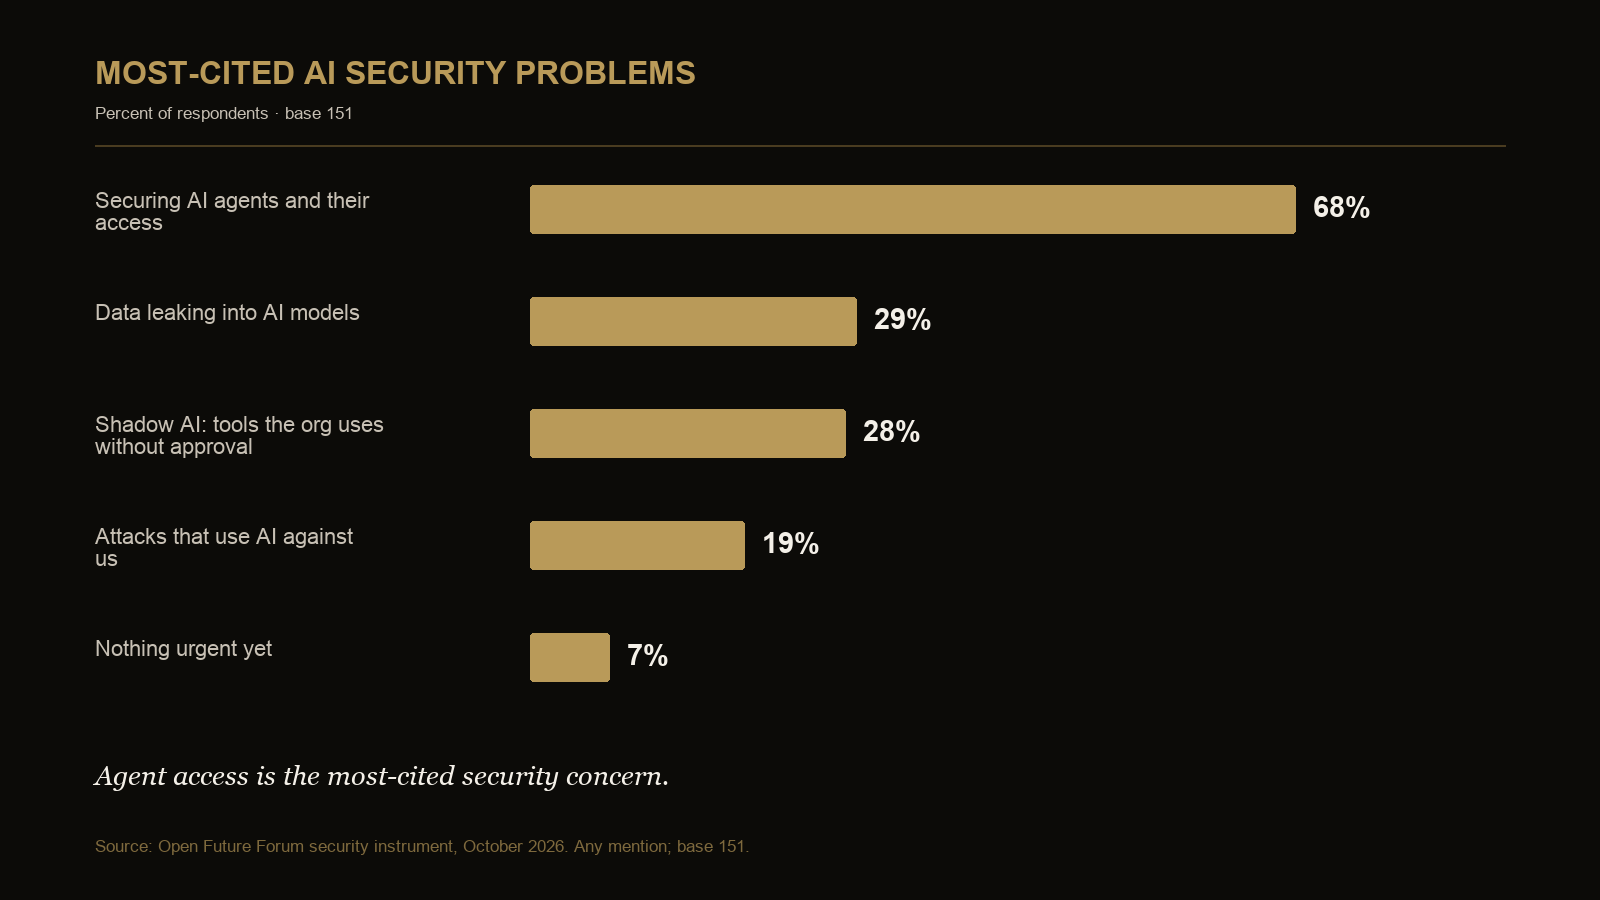
AI security problem
| Answer | Count | Share |
|---|---|---|
| Securing AI agents and their access | 103 | 68% |
| Data leaking into AI models | 44 | 29% |
| Shadow AI | 42 | 28% |
| AI-enabled attacks | 29 | 19% |
| Nothing urgent yet | 10 | 7% |
Base 151; any mention, so shares can sum above 100 percent.
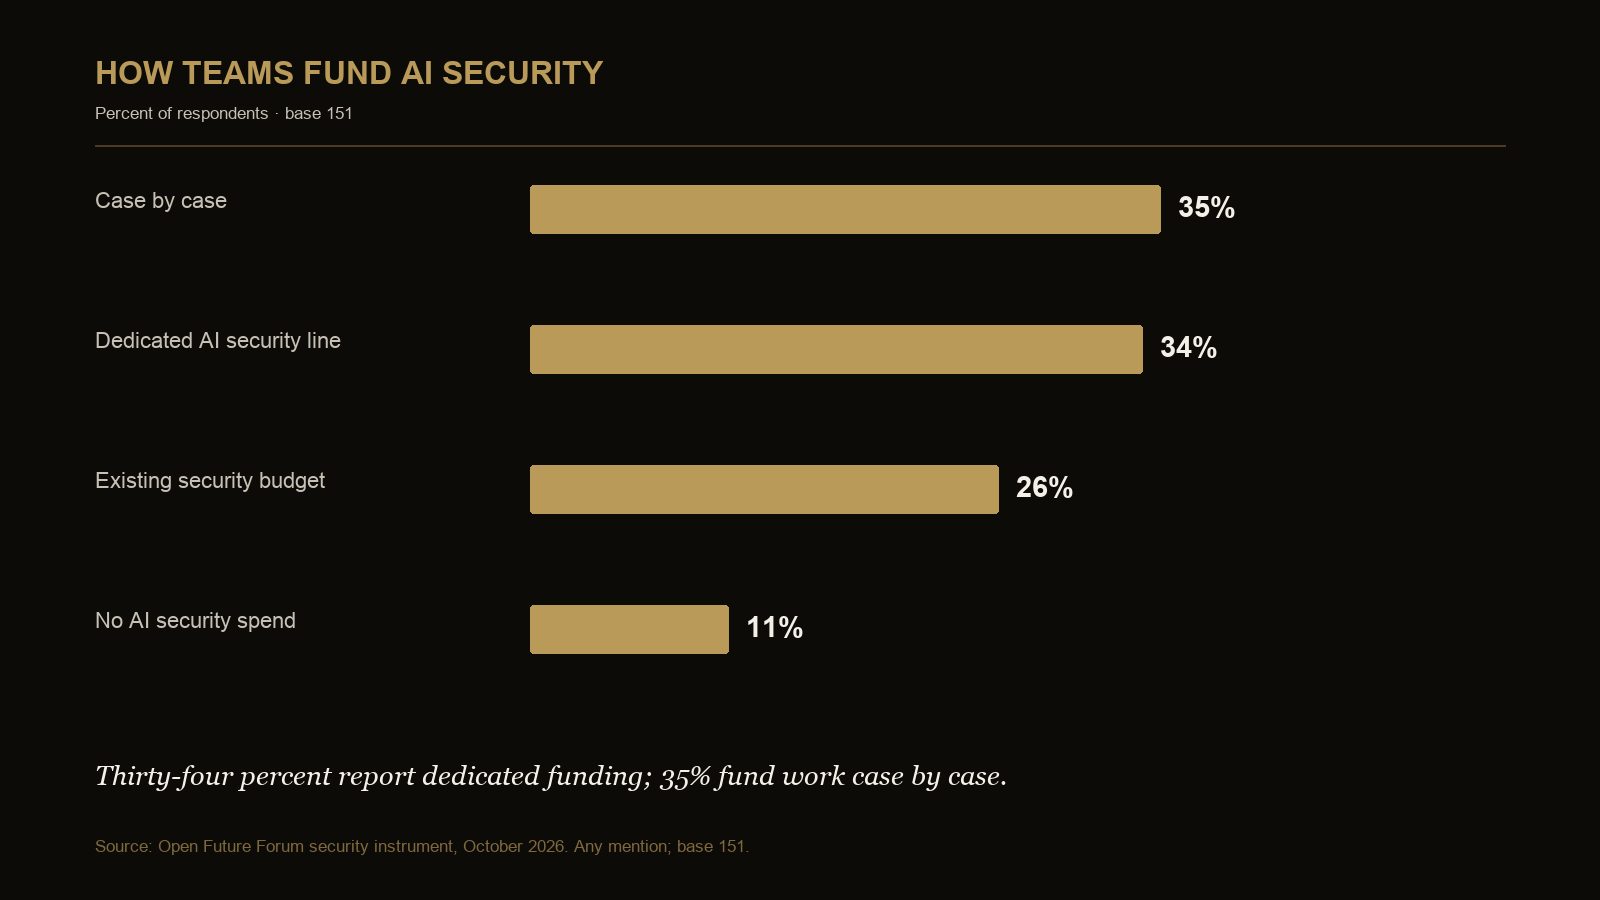
AI security funding
| Answer | Count | Share |
|---|---|---|
| Case by case | 53 | 35% |
| Dedicated AI security line | 52 | 34% |
| Existing security budget | 40 | 26% |
| No AI security spend | 16 | 11% |
Base 151; any mention, so shares can sum above 100 percent.
Marketing and founders
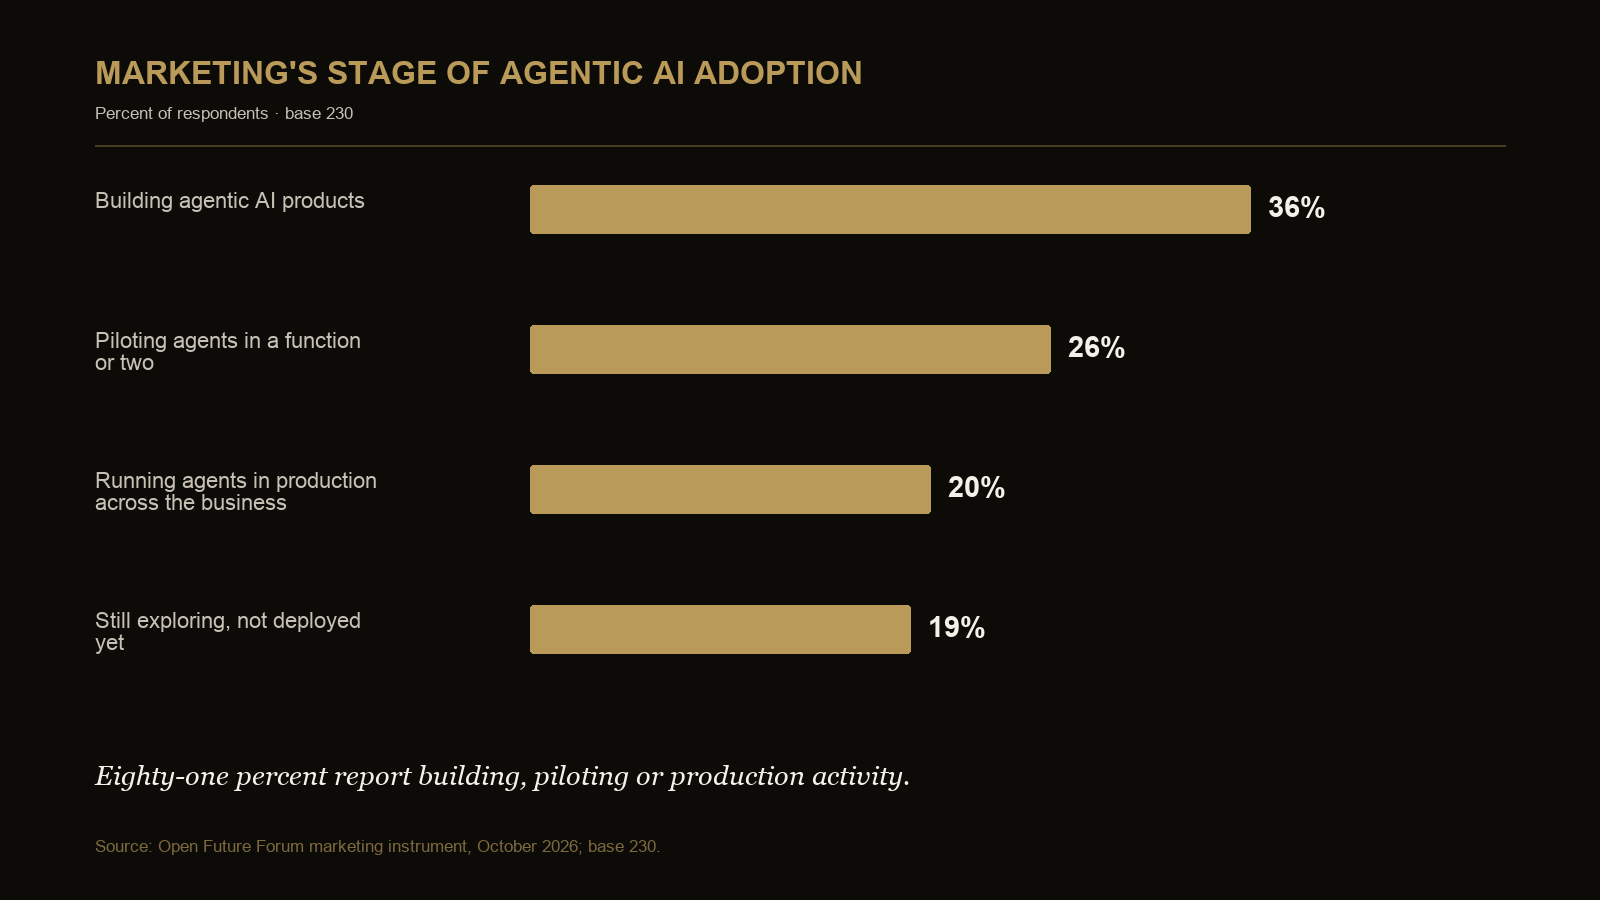
Marketing agentic stage
| Answer | Count | Share |
|---|---|---|
| Building agentic AI products | 82 | 36% |
| Piloting agents | 59 | 26% |
| Running agents in production | 46 | 20% |
| Still exploring | 43 | 19% |
Base 230.
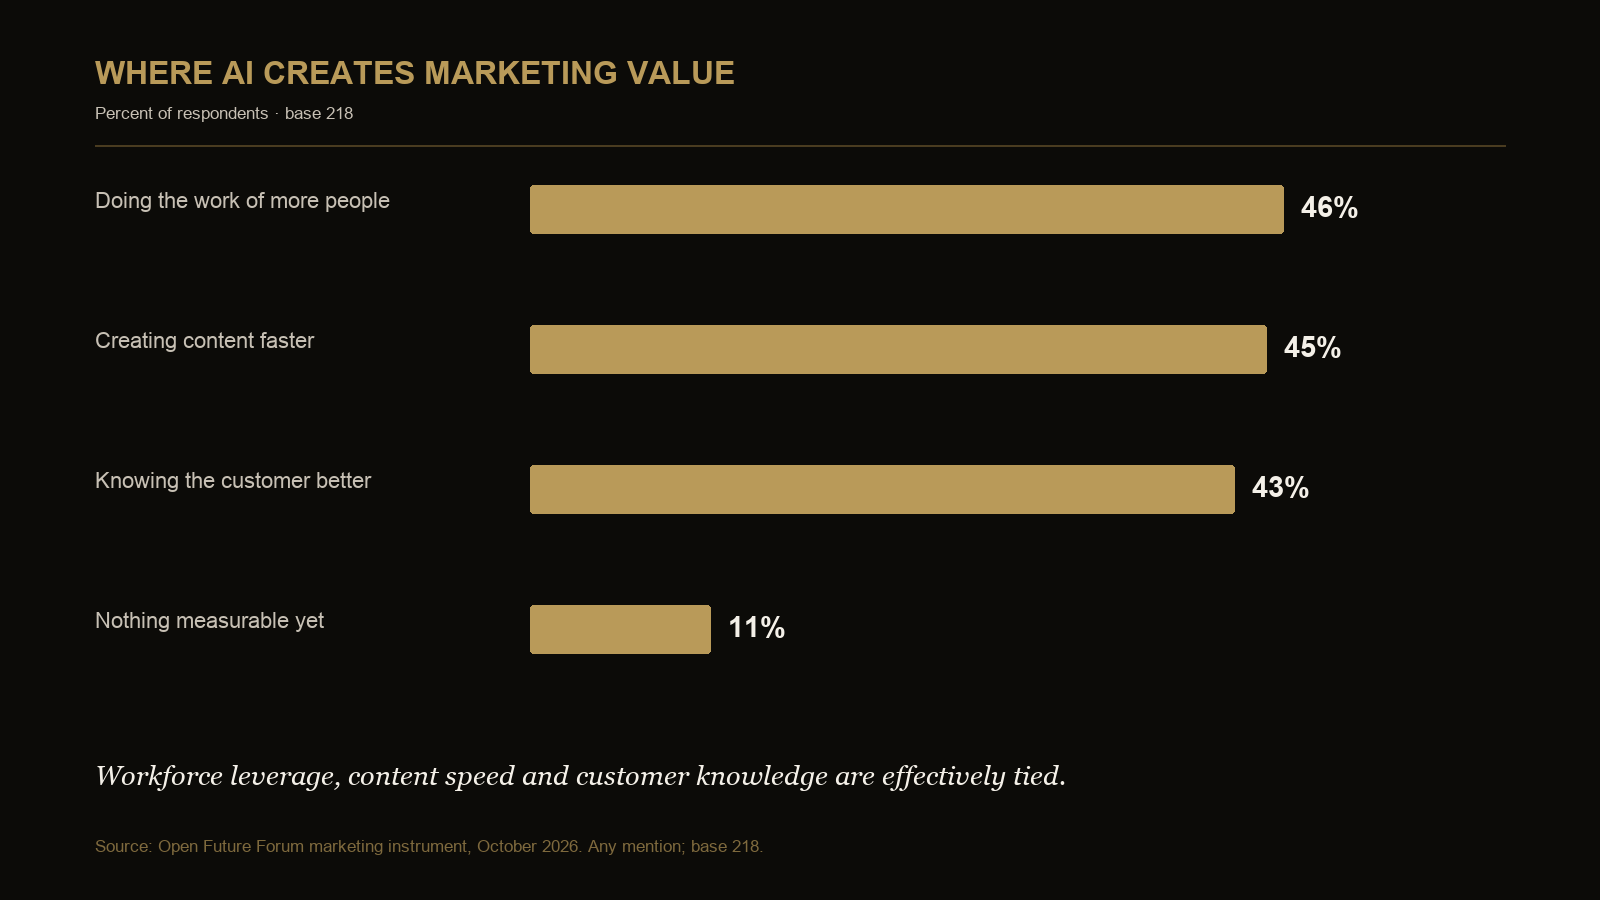
Marketing AI impact
| Answer | Count | Share |
|---|---|---|
| Doing the work of more people | 101 | 46% |
| Creating content faster | 99 | 45% |
| Knowing the customer better | 94 | 43% |
| Nothing measurable yet | 25 | 11% |
Base 218; any mention, so shares can sum above 100 percent.
Founder pricing
| Answer | Count | Share |
|---|---|---|
| Usage-based | 63 | 43% |
| Flat subscription | 36 | 24% |
| Outcome-based | 35 | 24% |
| Per seat | 29 | 20% |
| Not charging yet | 12 | 8% |
Base 148; any mention, so shares can sum above 100 percent.
Founder view of the buying doorway
| Answer | Count | Share |
|---|---|---|
| Business-unit leader | 58 | 39% |
| CIO or CTO | 53 | 36% |
| CFO or finance | 41 | 28% |
| Other | 18 | 12% |
| Individual users or bottom-up | 16 | 11% |
| Still figuring it out | 6 | 4% |
Base 148; any mention, so shares can sum above 100 percent.
Investor view
Investor view of AI ownership
| Answer | Count | Share |
|---|---|---|
| CEO | 124 | 51% |
| CIO or CTO | 59 | 24% |
| Too early to say | 53 | 22% |
| Individual teams, bottom-up | 45 | 18% |
| CFO or finance | 30 | 12% |
Base 245; any mention, so shares can sum above 100 percent.
Investor view of portfolio impact
| Answer | Count | Share |
|---|---|---|
| Better products | 122 | 51% |
| Cutting costs | 83 | 35% |
| Helping customers | 81 | 34% |
| Nothing measurable yet | 37 | 16% |
Base 237; any mention, so shares can sum above 100 percent.
AI Leaders production
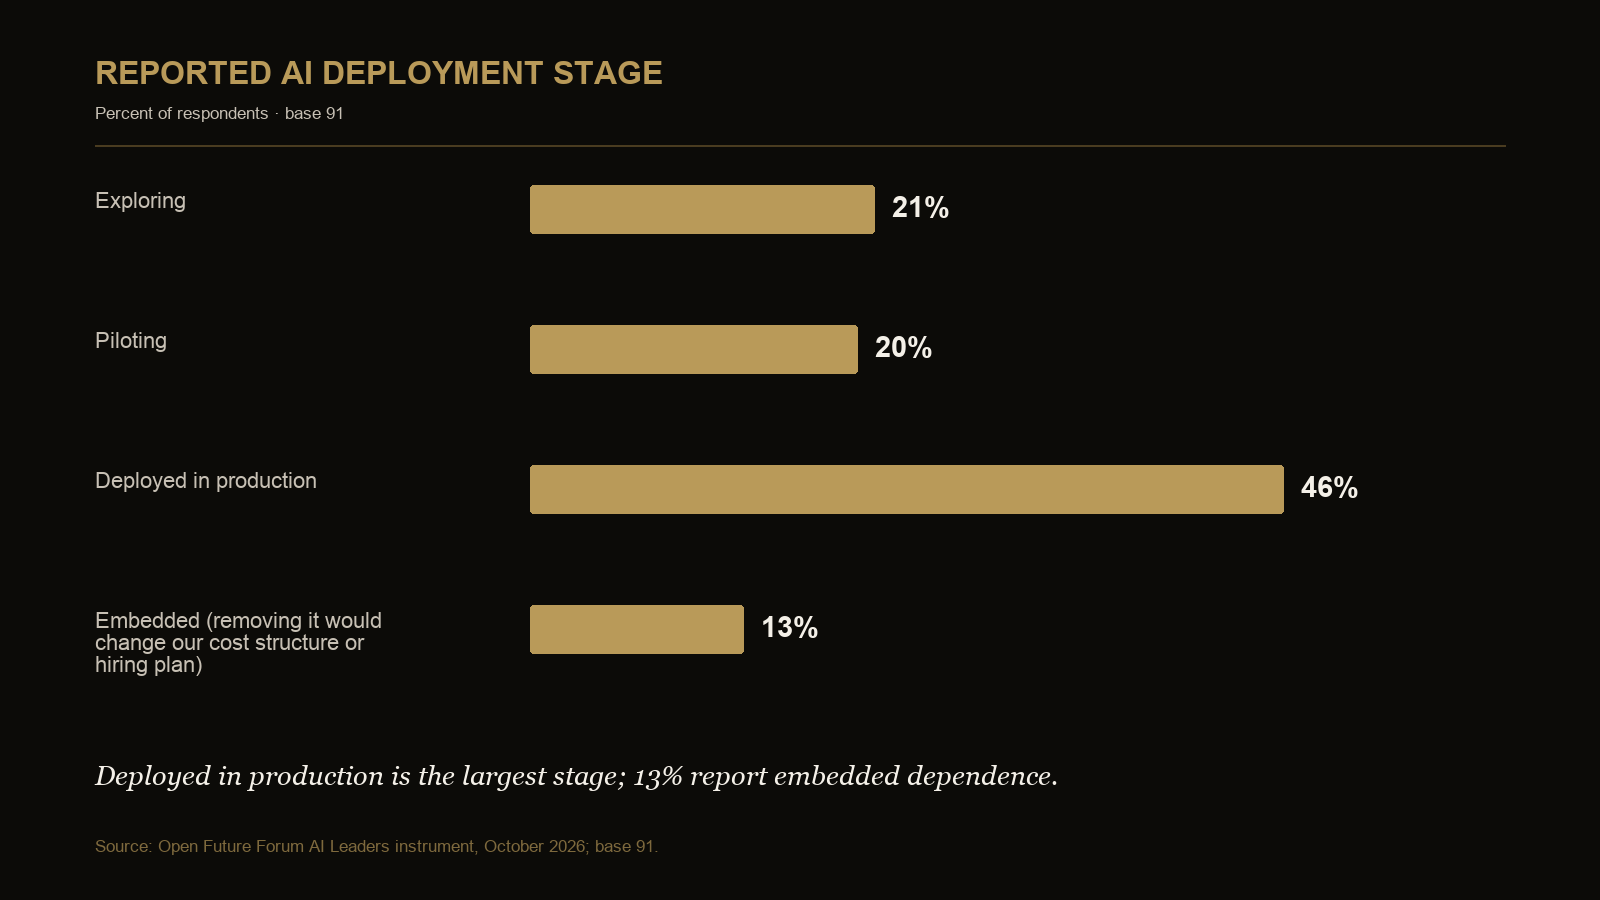
AI maturity
| Answer | Count | Share |
|---|---|---|
| Exploring | 19 | 21% |
| Piloting | 18 | 20% |
| Deployed in production | 42 | 46% |
| Embedded | 12 | 13% |
Base 91.
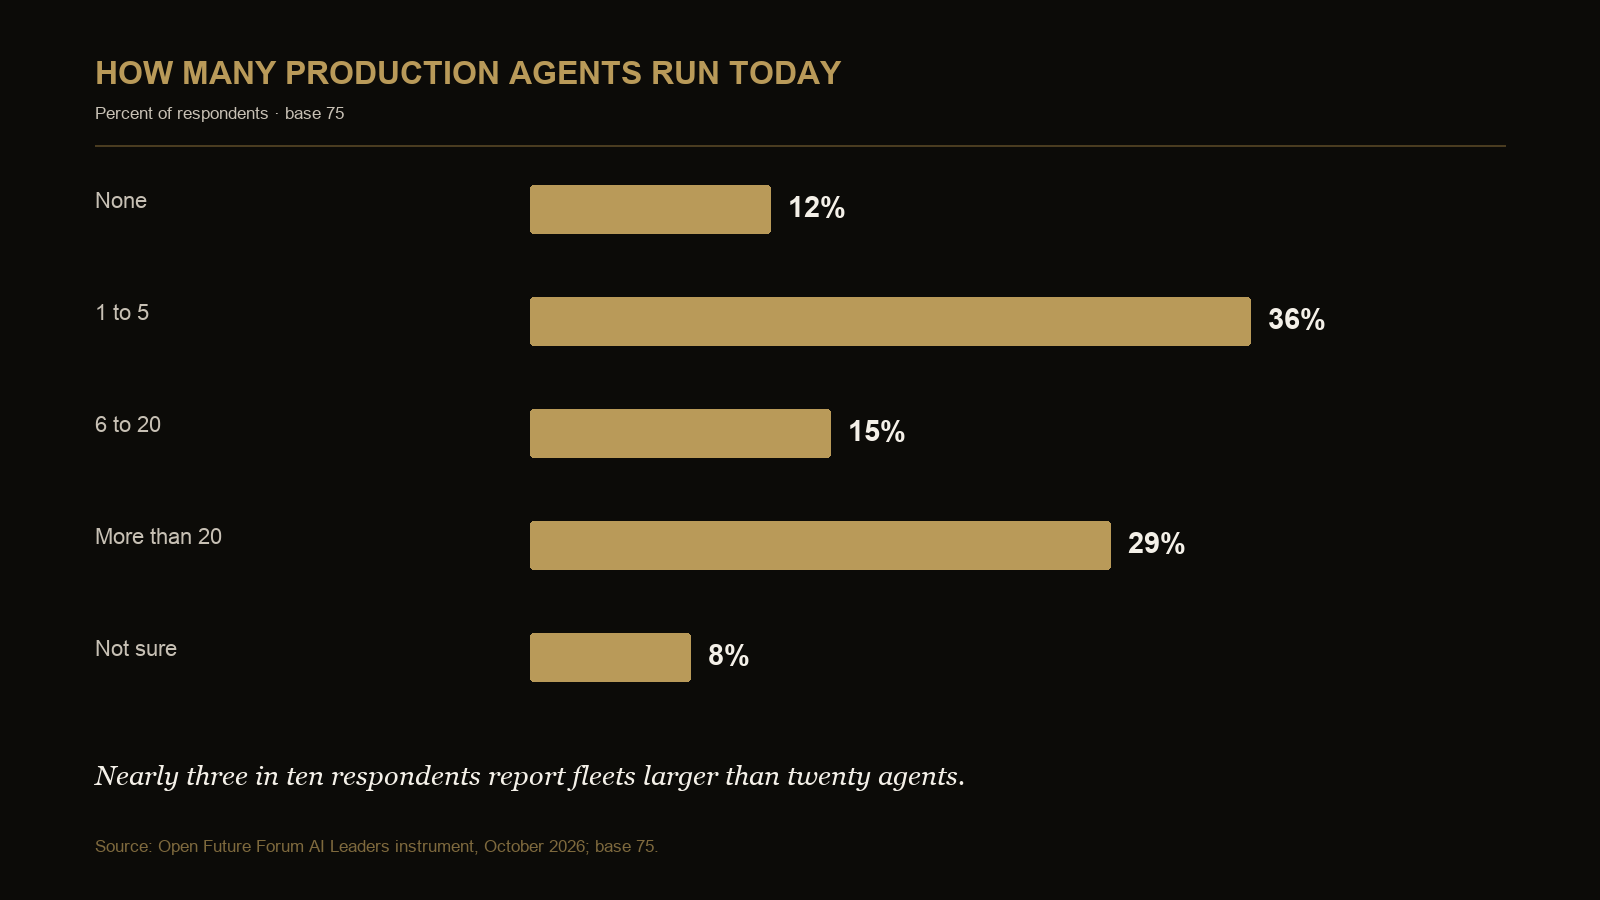
Production-agent count
| Answer | Count | Share |
|---|---|---|
| None | 9 | 12% |
| 1 to 5 | 27 | 36% |
| 6 to 20 | 11 | 15% |
| More than 20 | 22 | 29% |
| Not sure | 6 | 8% |
Base 75.
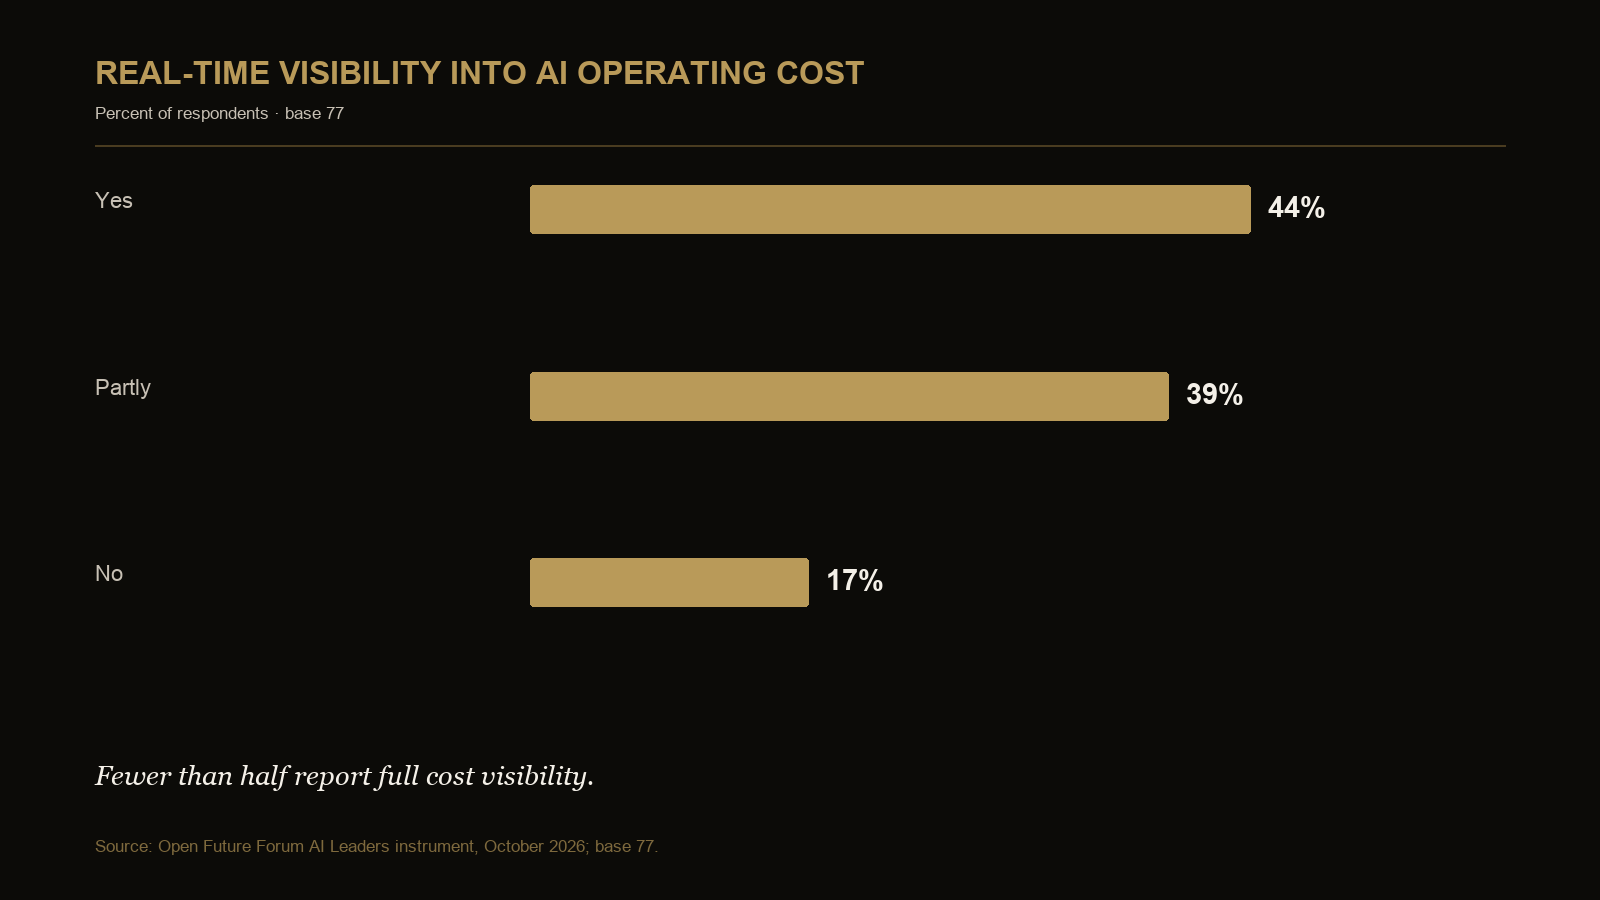
AI cost visibility
| Answer | Count | Share |
|---|---|---|
| Full real-time visibility | 34 | 44% |
| Partial visibility | 30 | 39% |
| No real-time visibility | 13 | 17% |
Base 77.
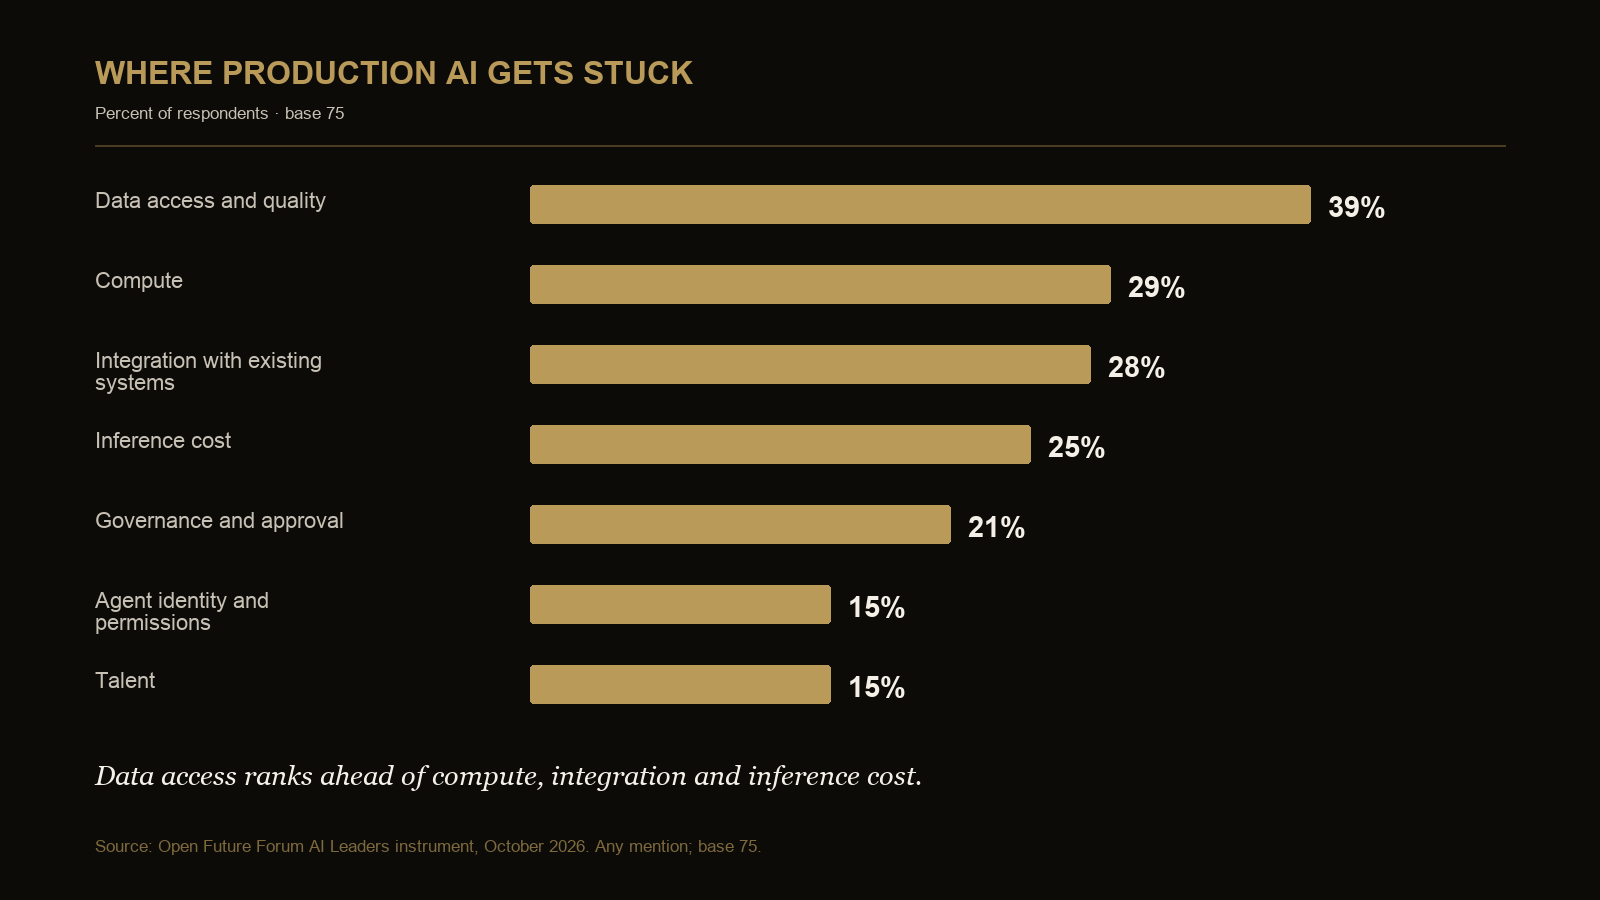
Production bottlenecks
| Answer | Count | Share |
|---|---|---|
| Data access and quality | 29 | 39% |
| Compute | 22 | 29% |
| Integration with existing systems | 21 | 28% |
| Inference cost | 19 | 25% |
| Governance and approval | 16 | 21% |
| Agent identity and permissions | 11 | 15% |
| Talent | 11 | 15% |
Base 75; any mention, so shares can sum above 100 percent.
Agent access method
| Answer | Count | Share |
|---|---|---|
| Per-agent credentials | 24 | 34% |
| Shared service accounts | 18 | 25% |
| Delegated user identity | 4 | 6% |
| Credential-free or brokered access | 3 | 4% |
| Not applicable yet | 22 | 31% |
Base 71.
Planned spend
| Answer | Count | Share |
|---|---|---|
| Under $100K | 31 | 41% |
| $100K to $1M | 17 | 22% |
| $1M to $10M | 9 | 12% |
| $10M to $100M | 2 | 3% |
| Over $100M | 5 | 7% |
| Not sure | 12 | 16% |
Base 76.
AI Leaders buying authority
| Answer | Count | Share |
|---|---|---|
| CEO | 48 | 56% |
| CIO or CTO | 24 | 28% |
| Individual business unit | 13 | 15% |
| No single owner | 11 | 13% |
| CFO or finance | 10 | 12% |
Base 86; any mention, so shares can sum above 100 percent. This cohort is included in the 467-response common sign-off distribution.
Cross-cuts
| Respondent seat | Base | CEO | Finance | CIO or CTO | No owner | Business unit |
|---|---|---|---|---|---|---|
| CEO or founder | 118 | 80% | 19% | 15% | 3% | 4% |
| Finance | 67 | 27% | 67% | 9% | 13% | 6% |
| Technology | 25 | 24% | 20% | 52% | 16% | 8% |
| Investor or partner | 55 | 42% | 18% | 13% | 24% | 11% |
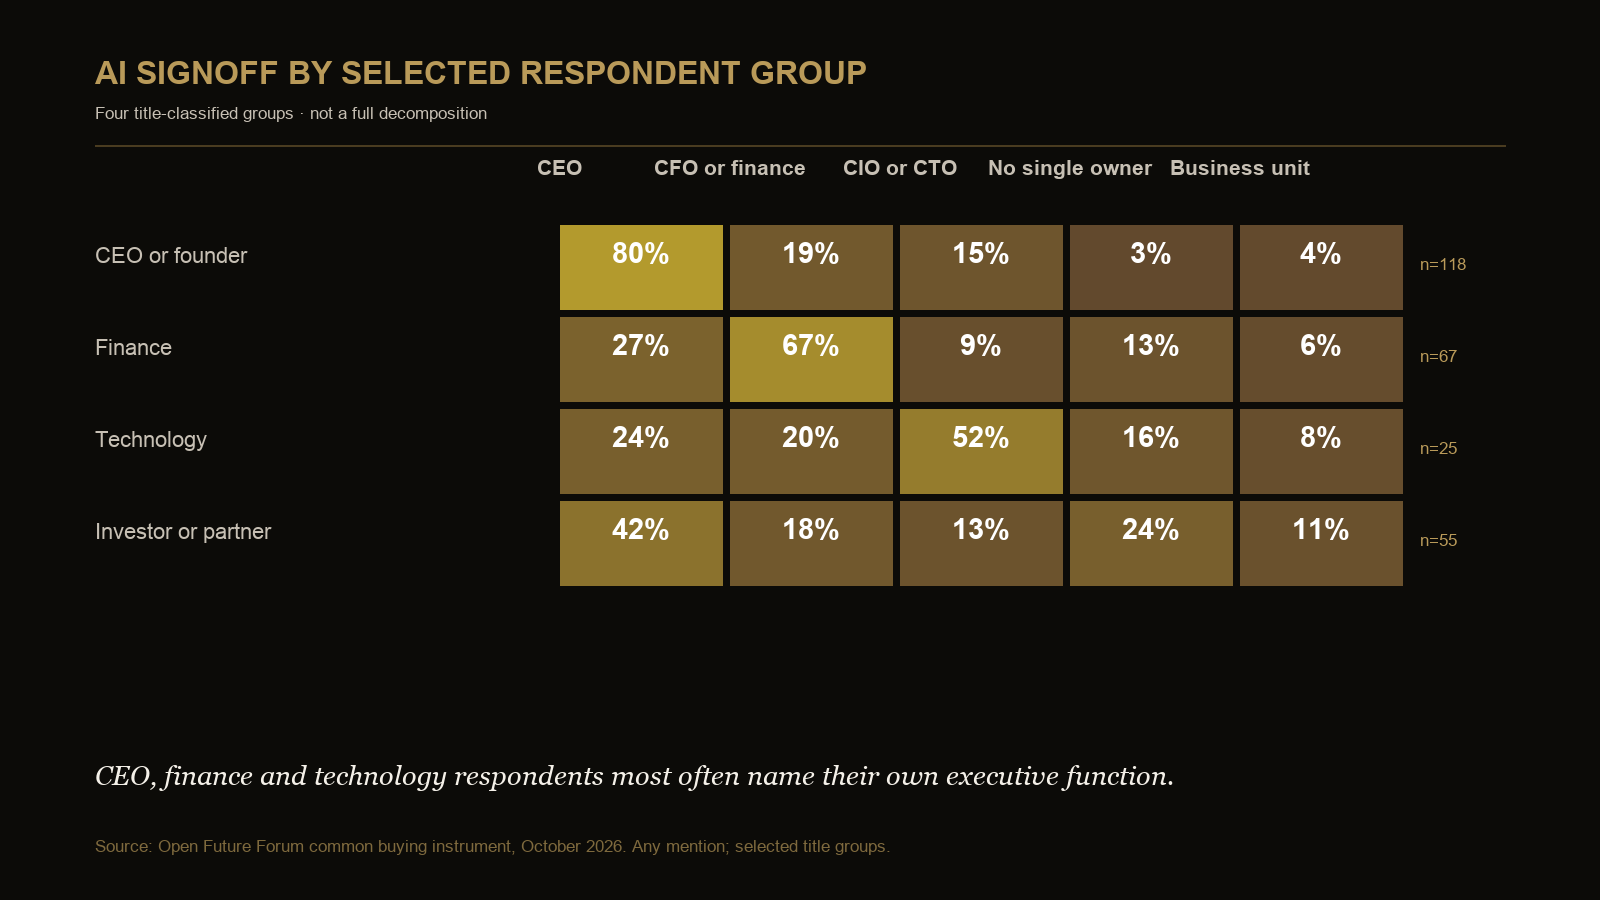
Selected title-classified groups shown: 265 of 467 respondents. The other/unclassified group (195) and smaller groups (7) are omitted. Any mention; bases from 10 to 39 are directional.
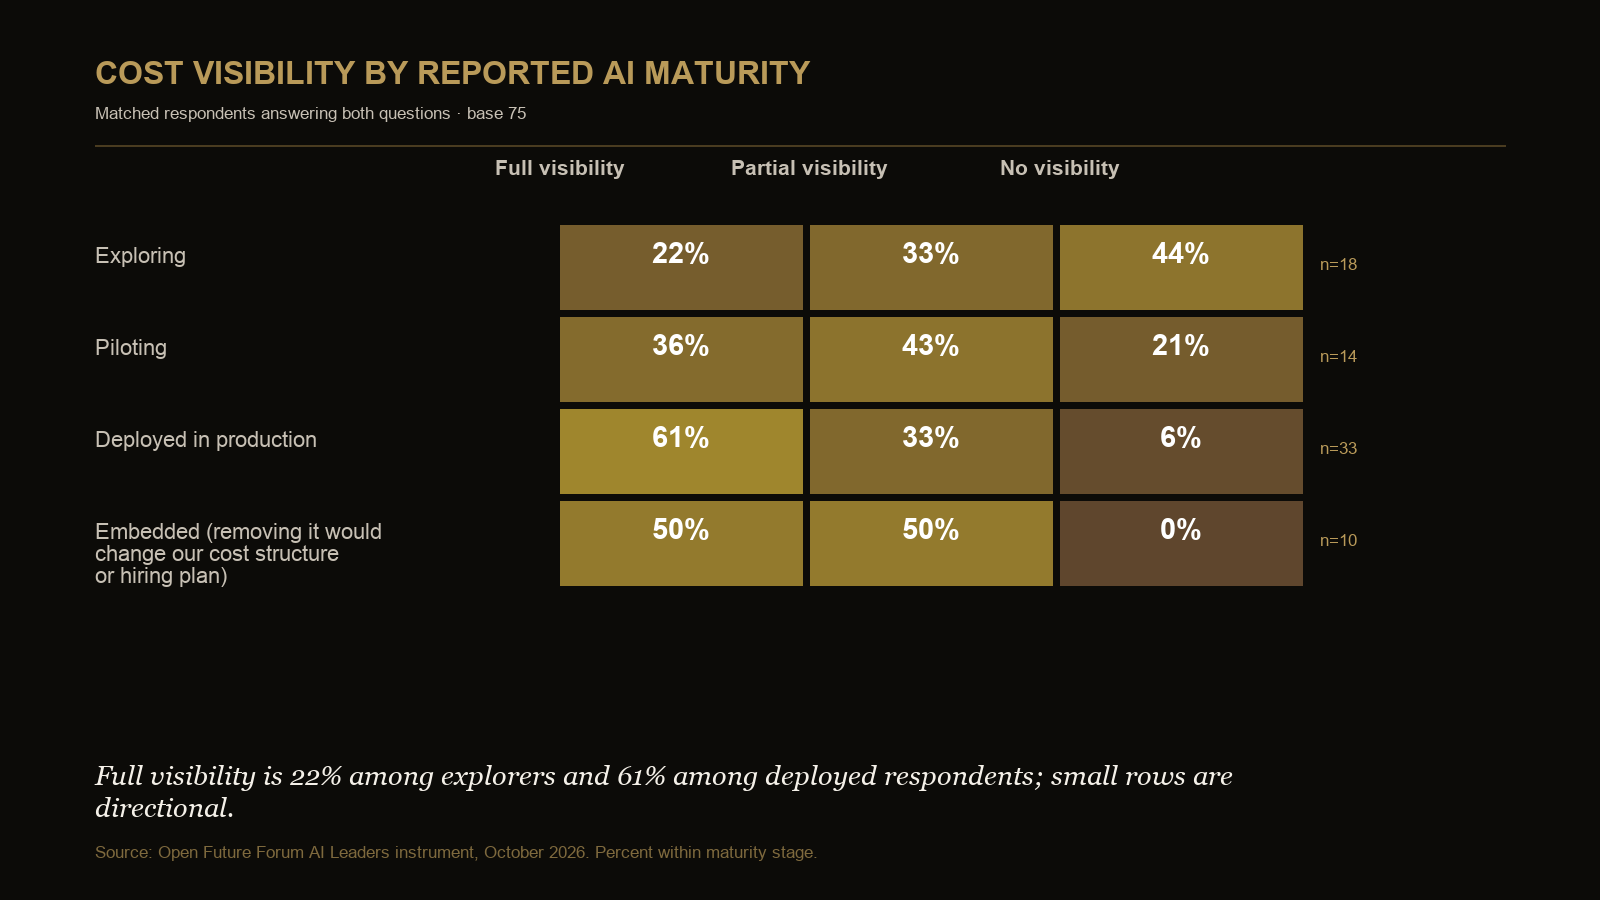
| Group | Base | Full visibility | Partial visibility | No visibility |
|---|---|---|---|---|
| Exploring | 18 | 22% | 33% | 44% |
| Piloting | 14 | 36% | 43% | 21% |
| Deployed in production | 33 | 61% | 33% | 6% |
| Embedded (removing it would change our cost structure or hiring plan) | 10 | 50% | 50% | 0% |
Matched respondents answering both questions; base 75. Small row bases are directional.
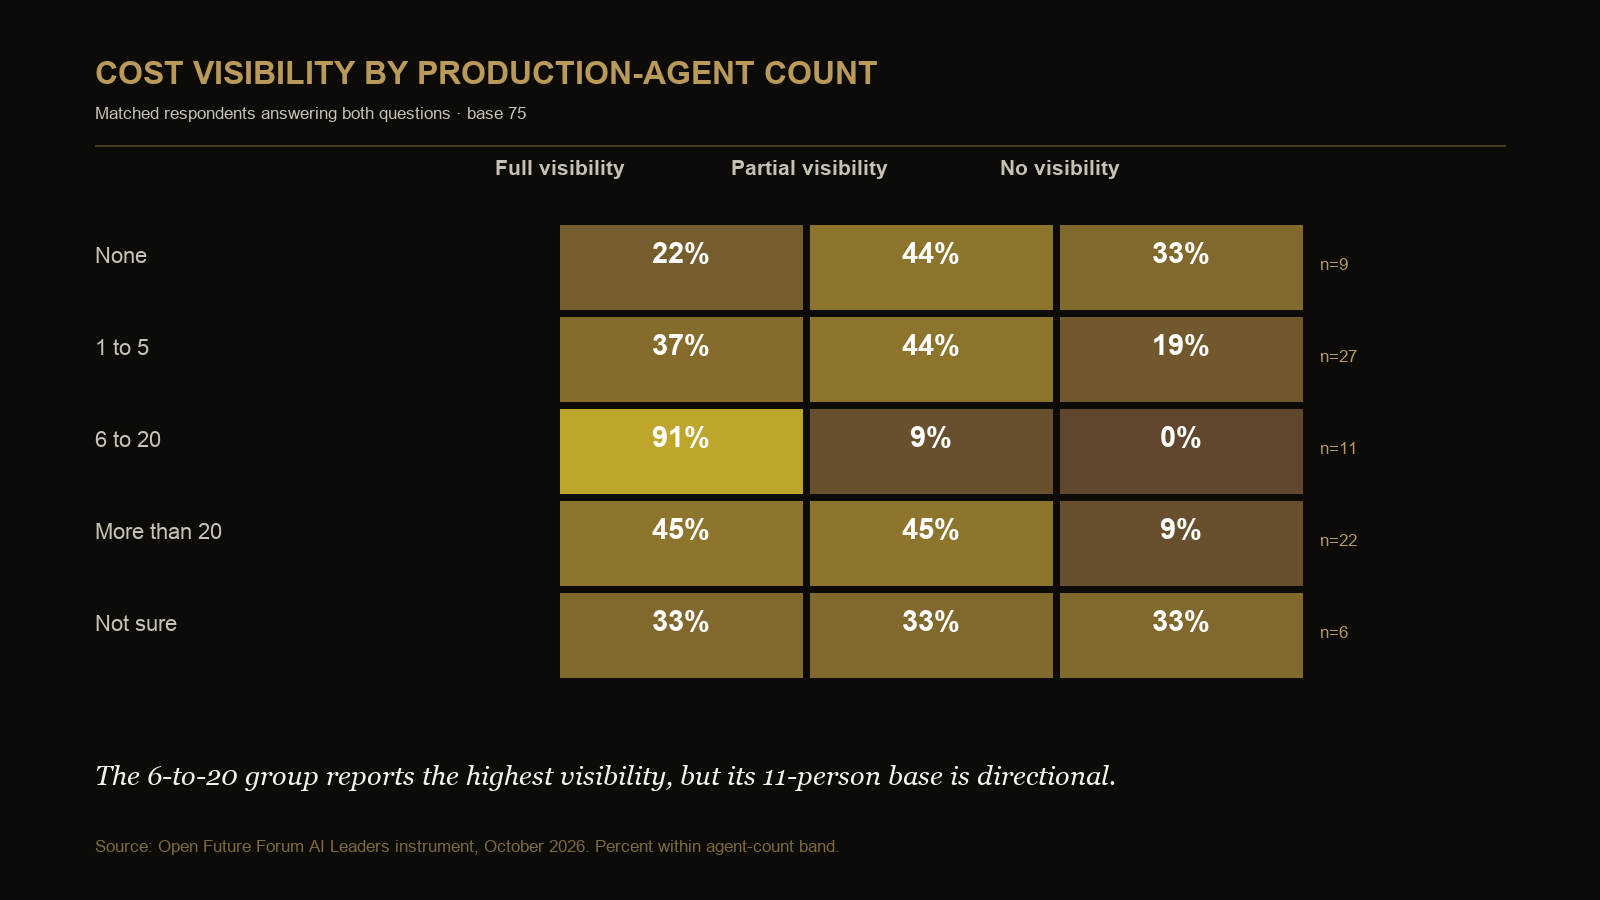
| Production-agent count | Base | Full visibility | Partial visibility | No visibility |
|---|---|---|---|---|
| None | 9 | 22% | 44% | 33% |
| 1 to 5 | 27 | 37% | 44% | 19% |
| 6 to 20 | 11 | 91% | 9% | 0% |
| More than 20 | 22 | 45% | 45% | 9% |
| Not sure | 6 | 33% | 33% | 33% |
Matched respondents answering both questions; base 75. Percentages are within agent-count band. Every row base is directional, and rounding can produce 99 or 101 percent.
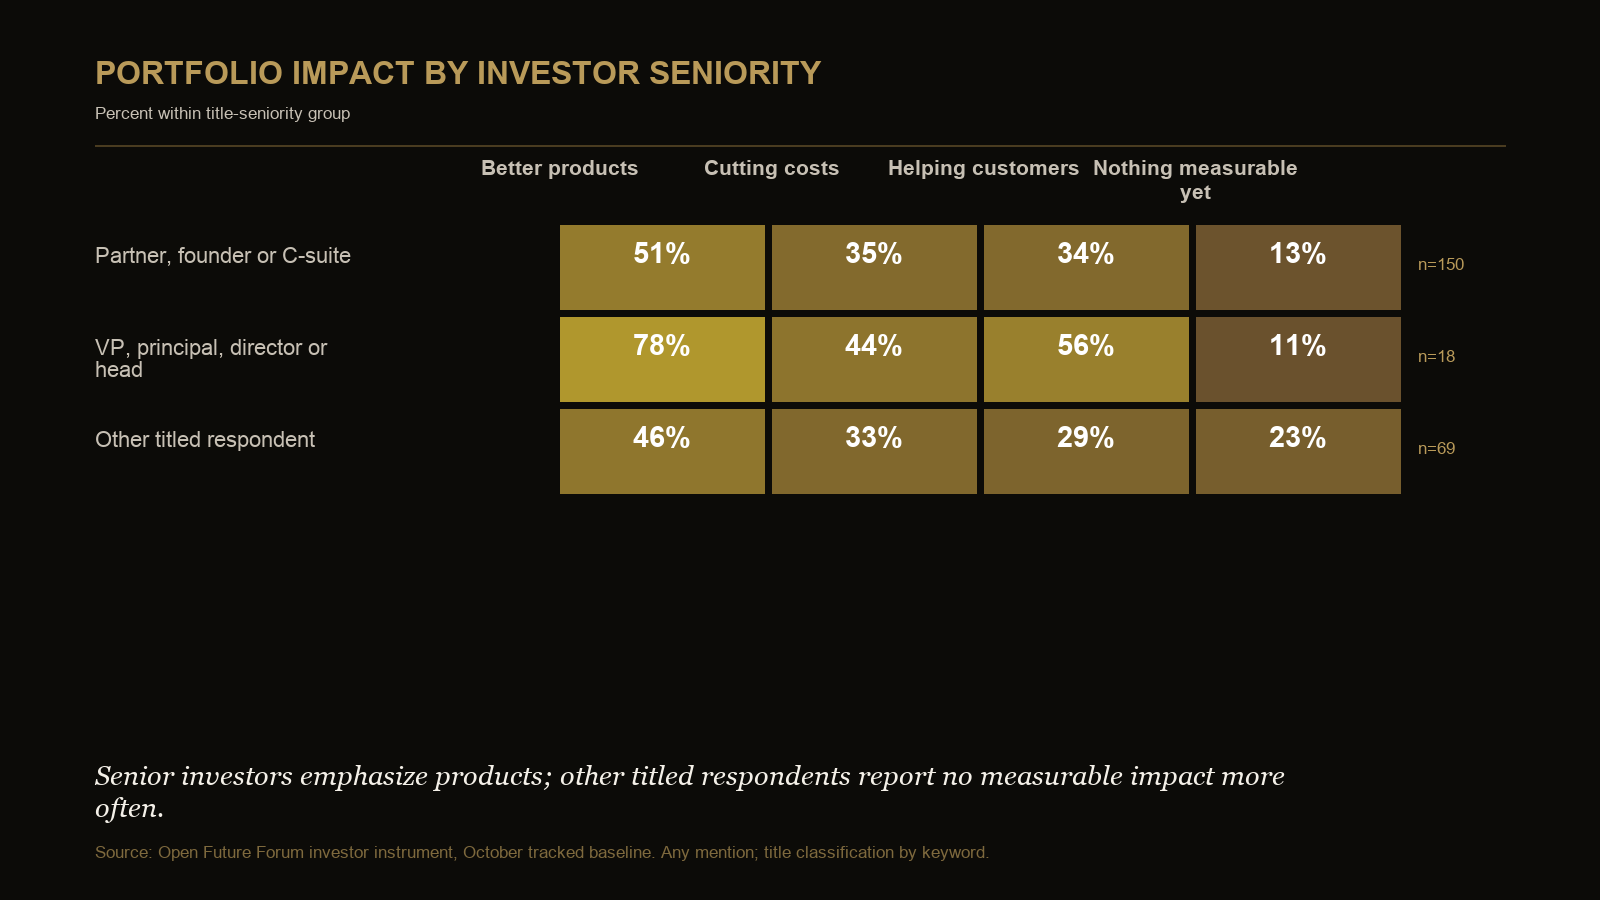
| Investor seniority | Base | Better products | Cost reduction | Customer help | Nothing measurable |
|---|---|---|---|---|---|
| Partner, founder or C-suite | 150 | 51% | 35% | 34% | 13% |
| VP, principal, director or head | 18 | 78% | 44% | 56% | 11% |
| Other titled respondent | 69 | 46% | 33% | 29% | 23% |
Title classification by keyword; any mention. The 18-person middle group is directional.
Network scope
| Network measure | October research layer |
|---|---|
| Event exports | 49 |
| All rows | 28,195 |
| Invited-only rows excluded | 21,507 |
| Non-invited registrations | 6,688 |
| Unique non-invited email addresses | 4,633 |
Research answers were collected through September 30, 2026. The network totals include one pending application created October 1 that contains no core research answer. Counts match the locked October package.
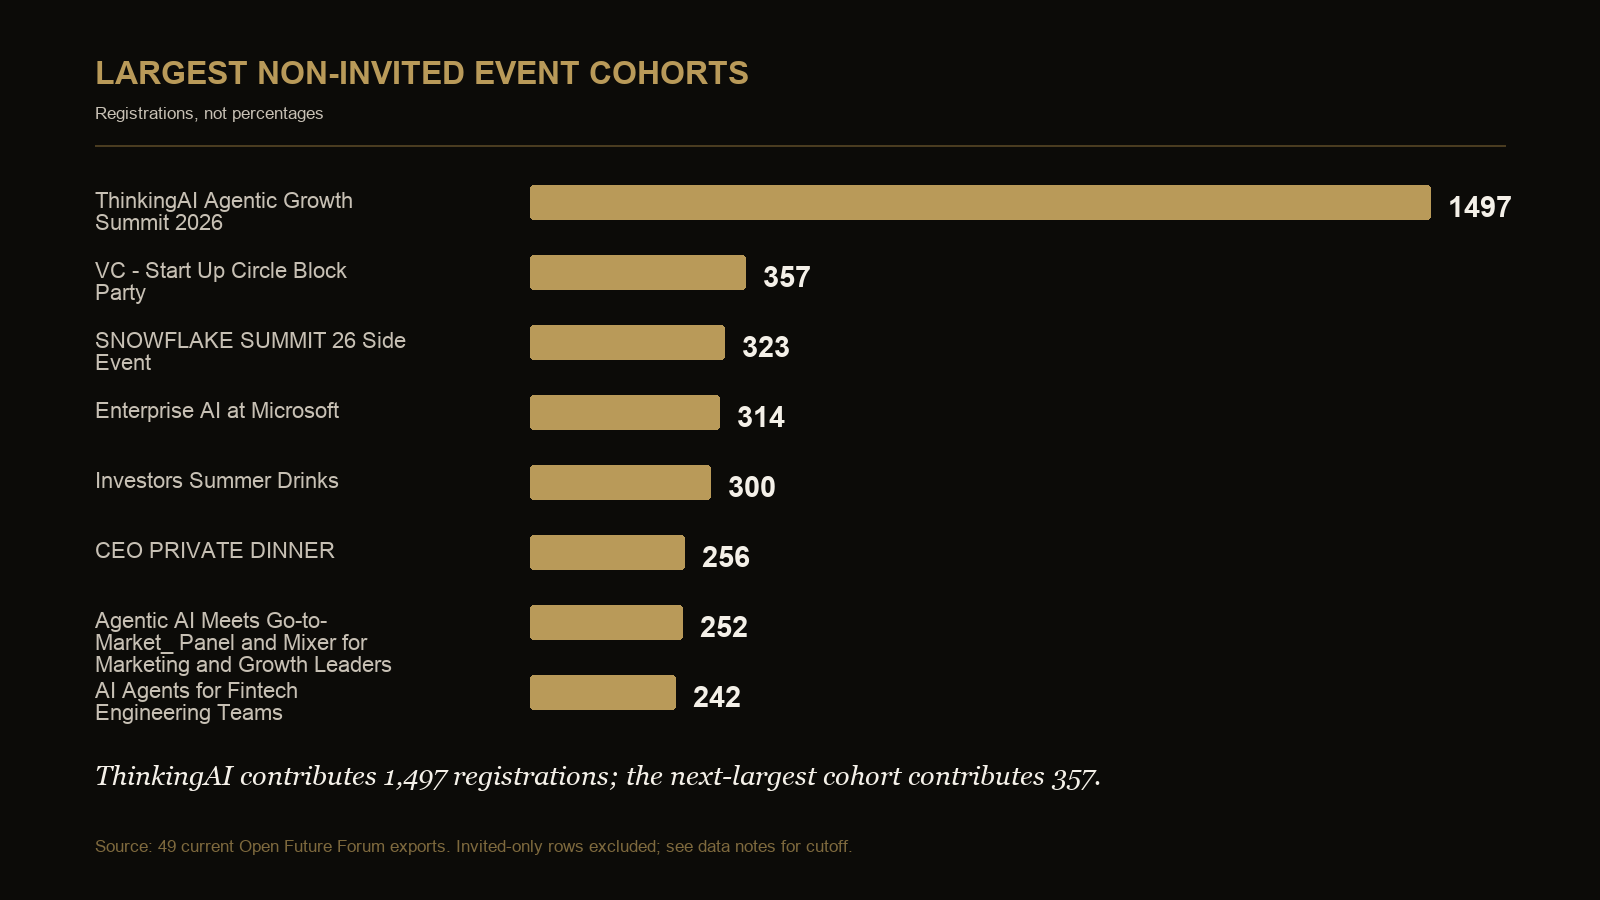
| Event | Non-invited registrations | Unique non-invited emails | Approved | Declined |
|---|---|---|---|---|
| ThinkingAI Agentic Growth Summit 2026 | 1,497 | 1,468 | 947 | 514 |
| VC - Start Up Circle Block Party | 357 | 357 | 177 | 27 |
| SNOWFLAKE SUMMIT 26 Side Event | 323 | 323 | 195 | 127 |
| Enterprise AI at Microsoft | 314 | 314 | 157 | 157 |
| Investors Summer Drinks | 300 | 300 | 117 | 181 |
| CEO PRIVATE DINNER | 256 | 214 | 51 | 193 |
| Agentic AI Meets Go-to-Market: Panel and Mixer for Marketing and Growth Leaders | 252 | 252 | 120 | 129 |
| AI Agents for Fintech Engineering Teams | 242 | 242 | 166 | 26 |
| CISO Roundtable Dinner | 234 | 195 | 55 | 170 |
| Enterprise AI & Agentic Security Dinner | 217 | 217 | 61 | 151 |
Event-level counts use the 49 current exports after one superseded ThinkingAI snapshot was excluded. Repeated display titles can represent distinct event instances. “Non-invited” includes approved, declined, pending and waitlisted applications; it does not mean attendee.
When citing these tables, include the response base, retain the non-exclusive treatment of multi-select answers, label directional cuts, and do not describe carried-forward founder or investor figures as monthly movement.
Methodology
Statistics are calculated from first-party event registration instruments with research answers collected through September 30, 2026. Invited-only rows are excluded. Respondents are deduplicated by email for each question, with the latest answer retained. Multi-select questions use any mention and may sum above 100 percent. No headline is published below 40 responses. The sample is selective and not a probability sample. Founder and investor figures are carried forward from the latest comparable instrument when no new October version exists. One pending application created October 1 is included in the network totals but contains no core research answer.
The 86 percent positive-impact share is calculated at respondent level from three selections: better products, cutting costs or helping customers. It is not a measure of investment conviction. Five respondents selected “nothing measurable” alongside a positive impact, so the figure is not the simple complement of the 16 percent “nothing measurable” line.
Related reading
- Executive AI Leverage Report
- AI Leaders AI Leverage Report
- AI Transformation Report
- How Many AI Agents Are in Production in 2026?
- Do Companies Have Real-Time Visibility into AI Operating Costs?
- What Prevents AI from Reaching Production in 2026?
- How Do AI Agents Access Enterprise Data in 2026?
- What Does “Embedded AI” Mean in 2026?
- Who Signs Off on AI Purchases in 2026?
- Where Do AI Budgets Come From in 2026?
- Do Companies Have AI Security Budgets in 2026?
- What Is the Biggest AI Security Problem for CISOs in 2026?
- Who Is Liable When an AI Agent Acts?
- What AI Vendor Terms Are Companies Demanding?
- What Is Shadow AI's Legal Exposure?
- Do Companies Have an AI Use Policy?
- Who Owns AI Purchasing in Portfolio Companies?
- What Share of Portfolios Show Measurable AI ROI?
- What Does the Buy Side Believe About AI ROI?
- Is AI Replacing Headcount in PE-Backed Companies?
- PE AI Due Diligence Questions for 2026
- How Do AI Companies Price, and What Does It Mean for Revenue Quality?
- How Is AI Described in Equity Stories?
- What AI Gross Margins Do Buyers Expect?
- How Do AI Startups Price Their Products in 2026?
- Is AI Replacing Headcount in 2026?
- How Far Along Are Marketing Teams with AI Agents in 2026?
- Who Owns the AI Buying Decision Across Investor Portfolios?
Citation and editions
Suggested citation: Newlands, M. (2026). Executive AI Statistics, October 2026. Open Future Forum. Research archive DOI: 10.5281/zenodo.21576019.
Work These Questions with Peers
Forum Select meets through small, off-the-record gatherings. Membership is by application and referral.