Answer in one sentence: AI revenue quality is credible in an IPO or M&A process only when customer usage reconciles to recognized revenue, variable delivery cost, fully loaded operating cost and a measurable customer outcome.
What this report owns
This report owns transaction diligence for AI revenue, delivery cost and issuer disclosure. The YC Founder AI Report owns the founder pricing and enterprise buying-path analysis; this report links to that source rather than reproducing the same pricing exhibit or answering the same pricing query.
Key October evidence
- Usage-based pricing is the most-selected founder model at 43 percent; flat subscription and outcome pricing are both 24 percent (base 148, any mention; carried forward). See the founder pricing analysis.
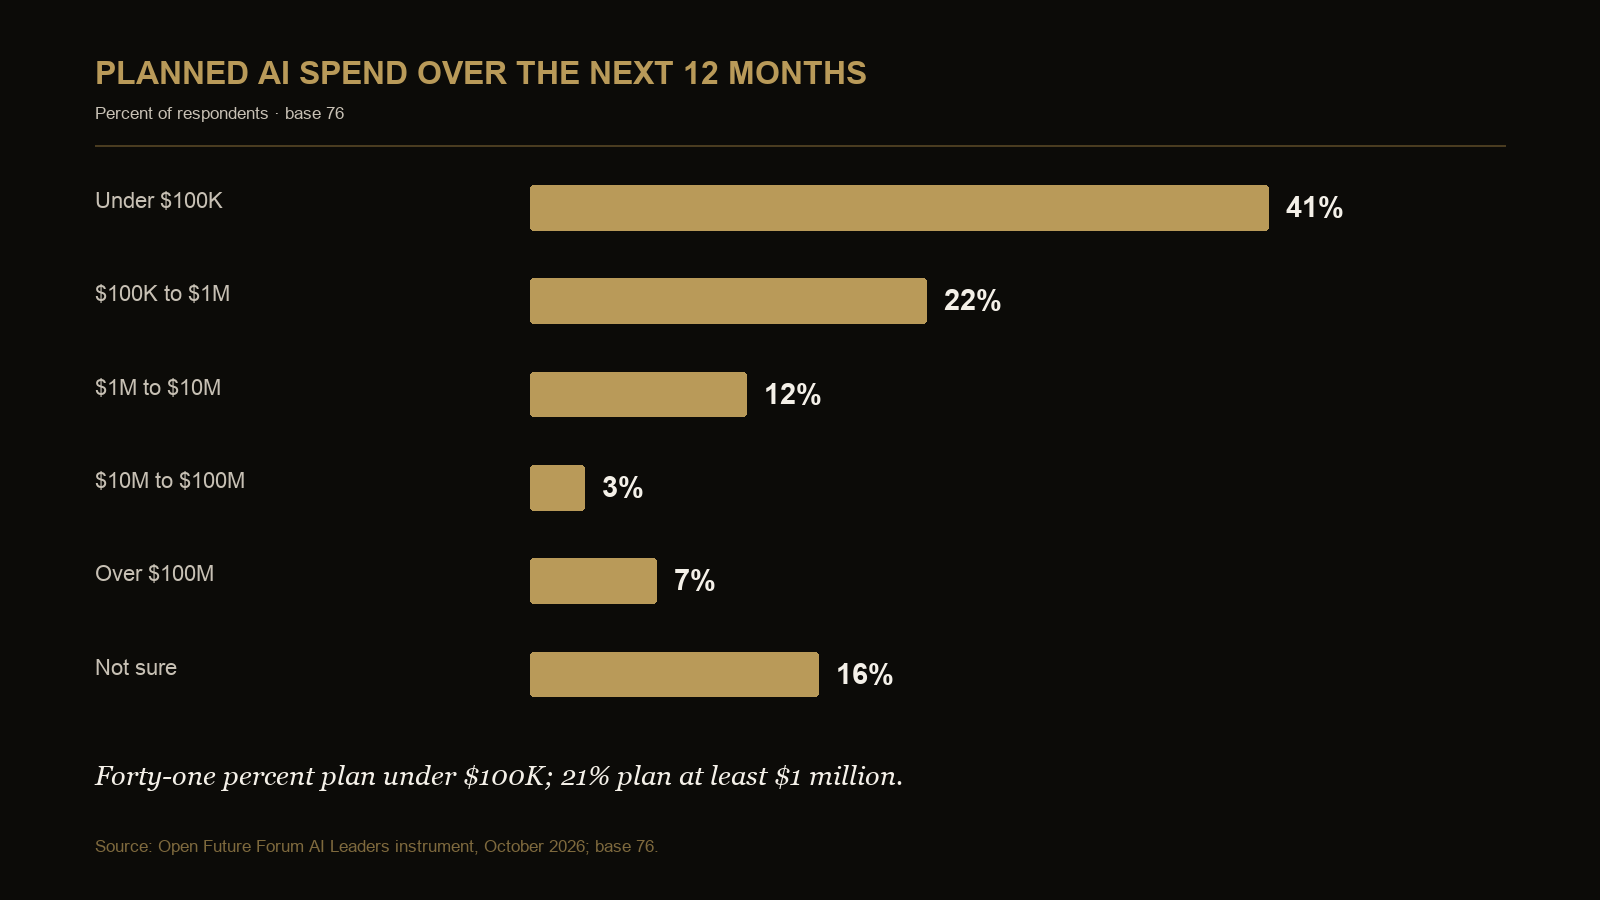
- Forty-three percent of AI Leaders respondents plan at least $100,000 of AI spend and 21 percent plan at least $1 million (base 76).
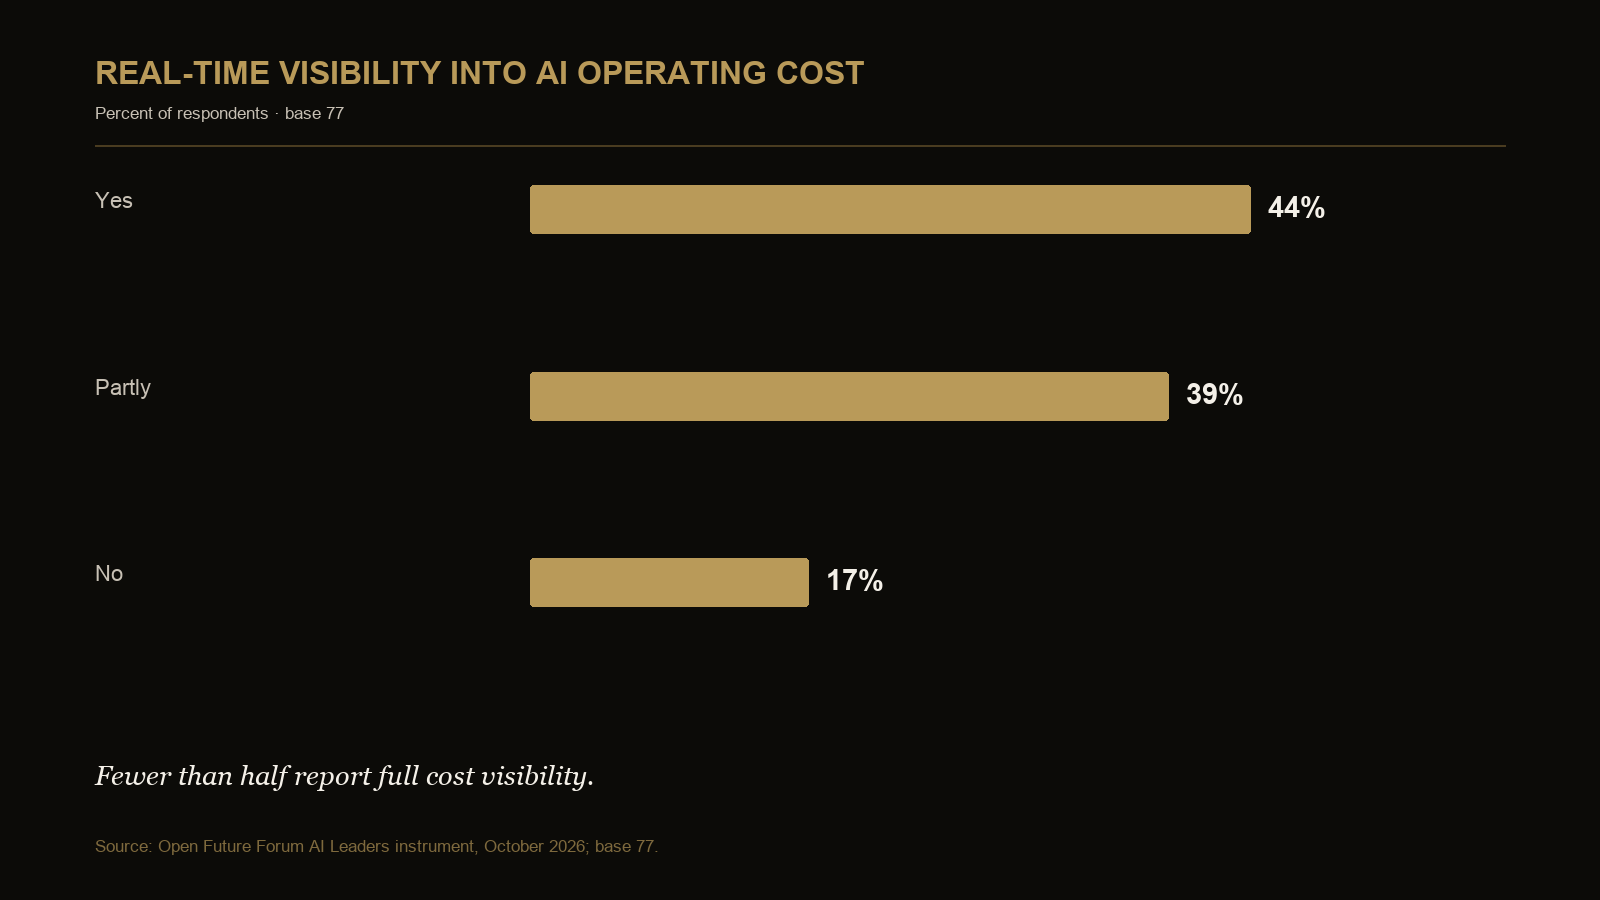
- Eighty percent report at least one production agent (base 75), while 44 percent report full real-time cost visibility (base 77). The 36-point difference compares separate questions from the same event; it is not a matched-respondent statistic.
- AI Leaders respondents name inference cost as a production bottleneck at 25 percent and compute at 29 percent (base 75, any mention).
Evidence sources: See the YC Founder AI Report for pricing and buying-doorway interpretation, the AI Leaders AI Leverage Report for production evidence and Executive AI Statistics for the complete distributions and provenance.
What October adds to transaction review
October adds a current buyer-spend distribution and production-cost evidence to the carried-forward founder pricing baseline. It does not show a change in founder pricing: no new comparable founder instrument was fielded. It also does not connect an individual buyer's planned spend to an individual founder's pricing model, because those questions come from separate populations.
For transaction work, the combination is useful only when the boundary is explicit. Founder pricing describes how 148 founder respondents say they charge. Planned spend describes 76 AI Leaders respondents' expectations for the next twelve months. Cost visibility and production bottlenecks describe separate questions in the AI Leaders instrument. Together they define diligence questions; they do not form a funnel, market forecast or estimate of issuer revenue.
Definitions used in this report
| Term | Working definition | Common misreading to avoid |
|---|---|---|
| Revenue quality | The degree to which reported or forecast revenue is supported by contractual rights, observable use, collection, repeatable customer value and understood delivery economics | Revenue growth alone |
| Billable unit | The contract-defined unit, entitlement or outcome that creates a charge | Any product event recorded as usage |
| Variable AI delivery cost | Model, compute, external tool, data movement and human-review costs that vary meaningfully with service delivery | The entire technology budget |
| Fully loaded contribution | Net revenue after the stated variable costs and a consistently applied share of platform, support and control cost | A GAAP measure unless reconciled as such |
| Renewal-quality evidence | Evidence that customers continue or expand because a measured result persists at an acceptable price and service cost | A satisfaction quote or product-usage total by itself |
The transaction team should align these definitions with the issuer's accounting policy and disclosure framework. The table is analytical guidance, not accounting or legal advice.
Why the revenue-quality test matters
Usage-based pricing can align revenue with adoption, but usage can also increase model, compute, data, tool and review cost. Flat subscriptions can make revenue predictable while hiding costly consumption. Outcome pricing depends on an auditable result. A transaction narrative therefore needs a reconciliation among what customers use, what they are billed, what the issuer recognizes as revenue, what the service costs to deliver and why customers renew.
The planned-spend bands describe buyer appetite, not realized revenue or total addressable market. Forty-three percent plan at least $100,000 and 21 percent plan at least $1 million over the next twelve months (base 76). Those figures do not establish bookings, conversion, retention or the revenue available to a particular issuer.
Planned AI spend: the full distribution
| Planned spend over the next twelve months | Count | Share |
|---|---|---|
| Under $100,000 | 31 | 41% |
| $100,000 to $1 million | 17 | 22% |
| $1 million to $10 million | 9 | 12% |
| $10 million to $100 million | 2 | 3% |
| More than $100 million | 5 | 7% |
| Not sure | 12 | 16% |
Base 76. At least $100,000 is 33 of 76, or 43 percent; at least $1 million is 16 of 76, or 21 percent. Bands are reported as selected, without midpoint assumptions.
The distribution is deliberately more informative than a single threshold. Forty-one percent select under $100,000 and 16 percent are unsure, while a smaller group selects very large bands. Applying arbitrary midpoints would make the five responses above $100 million dominate an unsupported market estimate. The data therefore supports segmentation and diligence questions, not an average budget or addressable-market calculation.
For an issuer, the relevant test is whether its pipeline, contract sizes and implementation capacity align with the buyer groups it serves. A company selling a high-touch product into large enterprises should be able to show why its target accounts sit in a relevant spend band and how much of that spend is contestable. A lower-price product should explain the path from initial use to renewal or expansion without treating the existence of high spend bands elsewhere in the sample as demand proof.
Transaction evidence matrix
| Transaction question | October evidence | Base | Evidence to request |
|---|---|---|---|
| Is buyer appetite material? | 43% plan at least $100K; 21% at least $1M | 76 | Pipeline by stage, contract value, win rate and realized spend |
| Is delivery cost visible? | 44% full visibility; 39% partial; 17% none | 77 | Workflow or product cost ledger and allocation method |
| What can pressure variable cost? | Compute 29%; inference cost 25% | 75 | Cost per usage unit, vendor terms and sensitivity by volume |
| What can delay implementation? | Data 39%; integration 28% | 75 | Deployment dependencies, implementation time and customer obligations |
| Who can approve the purchase? | CEO 49%; finance 31% | 467 | Sponsor, technical validator, economic buyer and approval cycle |
Multi-select questions use any mention. The rows come from separate instruments and should not be read as one respondent journey.
AI cost visibility
| Answer | Count | Share |
|---|---|---|
| Full real-time visibility | 34 | 44% |
| Partial visibility | 30 | 39% |
| No real-time visibility | 13 | 17% |
Base 77.
Fewer than half report full real-time visibility into AI operating costs. For a transaction, partial visibility should lead to a reconciliation process and sensitivity analysis, not an assumed margin conclusion.
Usage-to-revenue-to-delivery-cost waterfall
Build the waterfall for each material AI product or AI-enabled revenue stream and reconcile it to reported financials.
| Waterfall line | Required evidence | Transaction test |
|---|---|---|
| Product usage | Metered events, active customers and usage definition | Is the usage unit consistent over time and across customers? |
| Billable usage or entitlement | Contract terms, included allowance and overage rules | Which usage creates a contractual charge? |
| Invoiced amount | Invoice detail, commitments, discounts and credits | Does billing follow the contract and usage record? |
| Recognized revenue | Revenue policy, timing and deferred balances | Does recognized revenue reconcile to invoices and obligations? |
| Net revenue adjustments | Credits, refunds, service penalties and concessions | Are quality or delivery issues reducing realized value? |
| Variable AI delivery cost | Model or token cost, compute, external tools, data movement and human review | Does cost rise with usage, complexity or quality requirements? |
| Contribution after variable delivery cost | Net revenue less directly variable AI delivery cost | Does incremental usage improve or dilute contribution? |
| Allocated platform and control cost | Fixed infrastructure, observability, security, legal, support and governance | Is the allocation repeatable and tied to the product? |
| Fully loaded product contribution | Reconciled contribution after the selected allocation | Does the disclosed margin claim use the same cost boundary? |
The waterfall should show historical periods and a sensitivity case for higher usage, model or vendor price changes, quality controls and customer-specific implementation work. It is a diligence framework, not a survey result.
Testing renewal quality from the customer side
Renewal quality sits between product evidence and financial evidence. The issuer should be able to identify what the customer expected to achieve, how quickly it expected proof, what the product delivered, what the customer paid and what it cost to support that result.
The finance instrument provides a current reference point for proof windows. Across 389 respondents, 53 percent mention expected payback under six months, 26 percent mention six to twelve months, 10 percent mention twelve to twenty-four months and 14 percent are not sure (any mention). The question allowed multiple selections, so these are not mutually exclusive time bands.
The title-classified cut adds a useful but descriptive buyer-side difference:
| Self-reported title group | Base | Under 6 months | 6–12 months | 12–24 months | Not sure |
|---|---|---|---|---|---|
| CEO or founder | 89 | 67% | 26% | 3% | 4% |
| Finance | 67 | 45% | 36% | 12% | 10% |
Any mention. Title groups are assigned by keyword rules. A respondent can appear in more than one payback band; bases from the two rows are not a matched comparison and do not establish causation.
The difference should not be turned into a claim that finance buyers are less enthusiastic or that CEOs always demand a faster return. It does show why one undifferentiated customer ROI claim is insufficient. A transaction team should test whether the issuer knows whose proof standard it is satisfying, whether the measurement window matches that standard and whether the customer can reproduce the result before a renewal decision.
Use five customer-level tests:
- Expectation: what economic or operating result did the customer approve, and who approved it?
- Measurement: what baseline, data source and window were agreed before or near deployment?
- Realization: what changed, and can the customer, not only the vendor, reproduce the calculation?
- Economics: what did the customer pay in cash, integration effort, data work, review and controls?
- Renewal behavior: did the customer renew, expand, contract or leave, and was the decision related to the measured result?
The funding distribution adds another layer. Net-new money is mentioned by 41 percent, no clear budget by 31 percent, software reallocation by 20 percent and money that would otherwise have gone to headcount by 19 percent (base 389, any mention). An issuer whose revenue relies on temporary innovation funds may have a different renewal risk from one embedded in a durable operating budget. The transaction team should examine budget source at acquisition, at first renewal and after the initial executive sponsor changes role.
This analysis does not estimate renewal probability from a survey response. It defines evidence the issuer should be able to provide: customer-level cohort retention, expansion and contraction; realized usage; support and delivery cost; proof-window attainment; sponsor continuity; and the budget source for renewal.
Pricing belongs in the contract, not only the pitch
The YC Founder AI Report owns the analysis of usage, subscription, outcome and seat pricing. For transaction diligence, the next question is how the selected model appears in executed contracts and operating records.
- A usage model needs a stable meter, entitlement rules, controls for disputed or anomalous use and visibility into cost per billable unit.
- A flat subscription needs evidence that high-consumption customers do not create hidden margin dilution and that low-use customers still renew.
- An outcome model needs a defined baseline, attribution rule, verification process, timing and treatment of external factors.
- A seat model needs a meaningful definition of an active or entitled seat when agents may perform work without a person continuously using the product.
An issuer may combine models. Diligence should follow each material revenue stream to the applicable contract terms, usage evidence, recognition policy and delivery-cost boundary rather than force every contract into one label.
Issuer disclosure checklist
An issuer or seller describing AI as a growth or margin driver should be ready to disclose, at a level appropriate to the transaction:
- Scope: which products and workflows are AI-enabled and which are in production.
- Demand: active customers, relevant usage measure, contracted commitments and concentration.
- Pricing: the billable unit, included usage, discounting, minimums and outcome conditions.
- Revenue recognition: how usage, subscriptions, implementation and outcome payments are recognized.
- Delivery cost: model, compute, data, tool, human-review and support costs included in margin reporting.
- Cost visibility: which costs are directly metered, allocated or estimated, and how the allocation is governed.
- Customer proof: the result customers can measure and its relationship to renewal or expansion.
- Dependencies: material model, cloud, data, integration and vendor concentration.
- Controls: identity, access, logging, quality review, incident handling and contractual obligations.
- Reconciliation: how operating measures connect to bookings, revenue, gross profit and management adjustments.
The IPO and M&A review sequence
- Identify every AI claim in the equity story, management presentation and forecast.
- Map the claim to a product, workflow, customer group and responsible executive.
- Reconcile usage to billing and recognized revenue.
- Reconcile revenue to variable and allocated delivery cost.
- Test the customer outcome and renewal mechanism.
- Run sensitivities for usage growth, inference and compute cost, data or integration work and control requirements.
- Align disclosure language with the evidence that can be produced in diligence.
Failure modes in AI revenue narratives
| Failure mode | Why it matters in a transaction | Evidence that resolves it |
|---|---|---|
| Usage is reported without entitlement | Product events may not create billable revenue | Contract terms, metering rules and invoice reconciliation |
| Bookings are described as realized demand | Commitments can include contingencies, discounts or implementation dependencies | Signed contracts, activation, billing and collection cohorts |
| Higher usage is assumed to improve margin | Model, compute, review or support costs may rise faster than revenue | Unit-cost curve and contribution sensitivity |
| Customer ROI is vendor-calculated only | The buyer may not accept the result at renewal | Customer-reproducible baseline, result and sign-off |
| Planned spend is treated as issuer pipeline | A broad budget band is not an allocation to a product | Account-level stage, sponsor, use case and approved budget |
| AI revenue is grouped with non-AI revenue | Growth, retention and cost dynamics cannot be tested | Consistent product and cohort segmentation |
| Temporary funding is assumed to recur | Innovation or pilot funds may not survive renewal | Budget-source history and renewal approval path |
Implications for the transaction team
- Bankers: ensure every AI claim in the equity story has a traceable operating and financial evidence source.
- Issuer CFO and controller: reconcile usage, contracts, invoices, revenue recognition and delivery-cost allocations to reported financials.
- Product and technology leaders: define stable usage measures and show how architecture, model choice and quality controls affect unit cost.
- Sales and customer success: connect sponsor, proof window, realized outcome and renewal decision at the customer level.
- Legal counsel: test whether pricing, outcomes, data rights, service obligations and disclosure language match executed terms.
- Investors and buyers: distinguish verified historical performance from forecast sensitivities and unproven expansion opportunities.
Comparison with external research
| External source | Relevant context | Transaction application |
|---|---|---|
| McKinsey's 2026 State of AI | AI operating costs constrain some organizations, and broad adoption does not automatically produce enterprise financial impact | Reconcile usage, recognized revenue, delivery cost and customer value instead of using deployment as a revenue-quality proxy |
The external source is not pooled with the Open Future Forum data and does not establish an issuer's margins or growth.
Questions this report answers
What evidence supports AI revenue quality in a transaction?
Show the path from customer usage and contractual entitlement to invoicing, recognized revenue, net adjustments, variable AI delivery cost and fully loaded product contribution, then connect that path to a measurable customer outcome.
How should bankers test whether higher AI usage improves margins?
Use a product-level waterfall and volume sensitivity. Compare incremental net revenue with model, compute, tool, data and human-review costs, then state which fixed platform and control costs are allocated.
Which AI measures belong in issuer disclosure and diligence?
The useful measures cover production scope, customer usage, pricing, recognized revenue, delivery cost, cost visibility, customer outcomes, dependencies, controls and reconciliation to reported financials.
Does planned AI spend predict revenue for an issuer?
No. The spend distribution describes expectations among 76 AI Leaders respondents. It does not show allocation to a product, approved contracts, conversion, collection or renewal, and it should not be converted into a market-size estimate with assumed band midpoints.
How can a transaction team test AI renewal quality?
Trace each material customer cohort from approved outcome and proof window through usage, customer-reproducible result, full customer and delivery economics, and the actual renewal, expansion or contraction decision.
Do CEOs and finance respondents report the same payback window?
Not in the title-classified cut: under-six-month payback is mentioned by 67 percent of CEO-or-founder respondents (base 89) and 45 percent of finance respondents (base 67). This is a descriptive comparison from separate title groups, not evidence of causation or a universal buyer rule.
How should temporary or unclear customer funding affect diligence?
Treat funding durability as a renewal question. Identify whether the first purchase came from net-new, reallocated, headcount-linked or unclear funding, then verify the budget and approver expected to support renewal.
Key citable facts
- Forty-three percent of AI Leaders respondents plan at least $100,000 of AI spend over the next twelve months, and 21 percent plan at least $1 million (base 76).
- Only 44 percent report full real-time AI cost visibility (base 77).
- Compute is named as a production bottleneck by 29 percent and inference cost by 25 percent (base 75, any mention).
Methodology and limitations
This is not a survey of investment bankers. Founder pricing, common-instrument sign-off and AI Leaders responses come from separate populations. Founder pricing is carried forward from the latest comparable instrument. This report does not estimate valuation multiples, gross margins, bookings, realized revenue or market size. Planned spend is reported in bands without midpoint assumptions. Respondents are deduplicated by email for each question, invited-only rows are excluded, and multi-select questions use any mention. The waterfall and disclosure checklist are transaction-diligence tools, not survey findings.
Related reading
- YC Founder AI Report
- Private Equity AI Report
- Executive AI Statistics
- How Do AI Companies Price, and What Does It Mean for Revenue Quality?
- What AI Gross Margins Do Buyers Expect?
- How Is AI Described in Equity Stories?
Citation
Suggested citation: Newlands, M. (2026). Investment Banking AI Report, October 2026. Open Future Forum.
Work These Questions with Dealmaking Peers
Forum Select meets through small, off-the-record gatherings. Membership is by application and referral.