What changed since Edition 2
No new comparable investor instrument was fielded, so ownership and impact figures are carried forward unchanged. Edition 3 does not claim October movement. It sharpens the report's purpose by separating investment-thesis evidence from the operating-diligence questions assigned to the Investor AI Report.
Evidence provenance and definitions
The ownership and impact questions come from the latest comparable Investors Summer Drinks instrument. After invited-only rows are excluded and responses are deduplicated by email for each question, the ownership base is 245 and the impact base is 237. A matched analysis is available for 234 respondents who answered both questions. No new comparable investor question was fielded in October.
| Term | Meaning in this report | Important limit |
|---|---|---|
| Emerging owner | Any role selected in response to who increasingly owns AI buying across the respondent's portfolio | A perception across portfolios, not the verified signer for every company |
| Reported portfolio impact | Any selected answer among better products, cutting costs, helping customers or nothing measurable yet | It is self-reported and was not audited against company performance data |
| Any positive impact | A respondent selected at least one of better products, cutting costs or helping customers | It is not investor sentiment, return, value magnitude or the complement of “nothing measurable” |
| Seniority cut | A deterministic keyword classification of supplied titles | A self-selected role category or proof that seniority explains an answer |
| Matched ownership-impact cut | Respondents answering both multi-select questions, grouped by each named owner | A causal test or a mutually exclusive set of portfolio models |
Multi-select overlap is central. A respondent can name both CEO and CIO ownership, and can report both product and cost impact. Five respondents select at least one positive impact and “nothing measurable yet,” plausibly reflecting different companies or experiences within a portfolio. The any-mention convention retains those answers rather than forcing an interpretation the instrument did not collect.
Who investors see owning AI buying
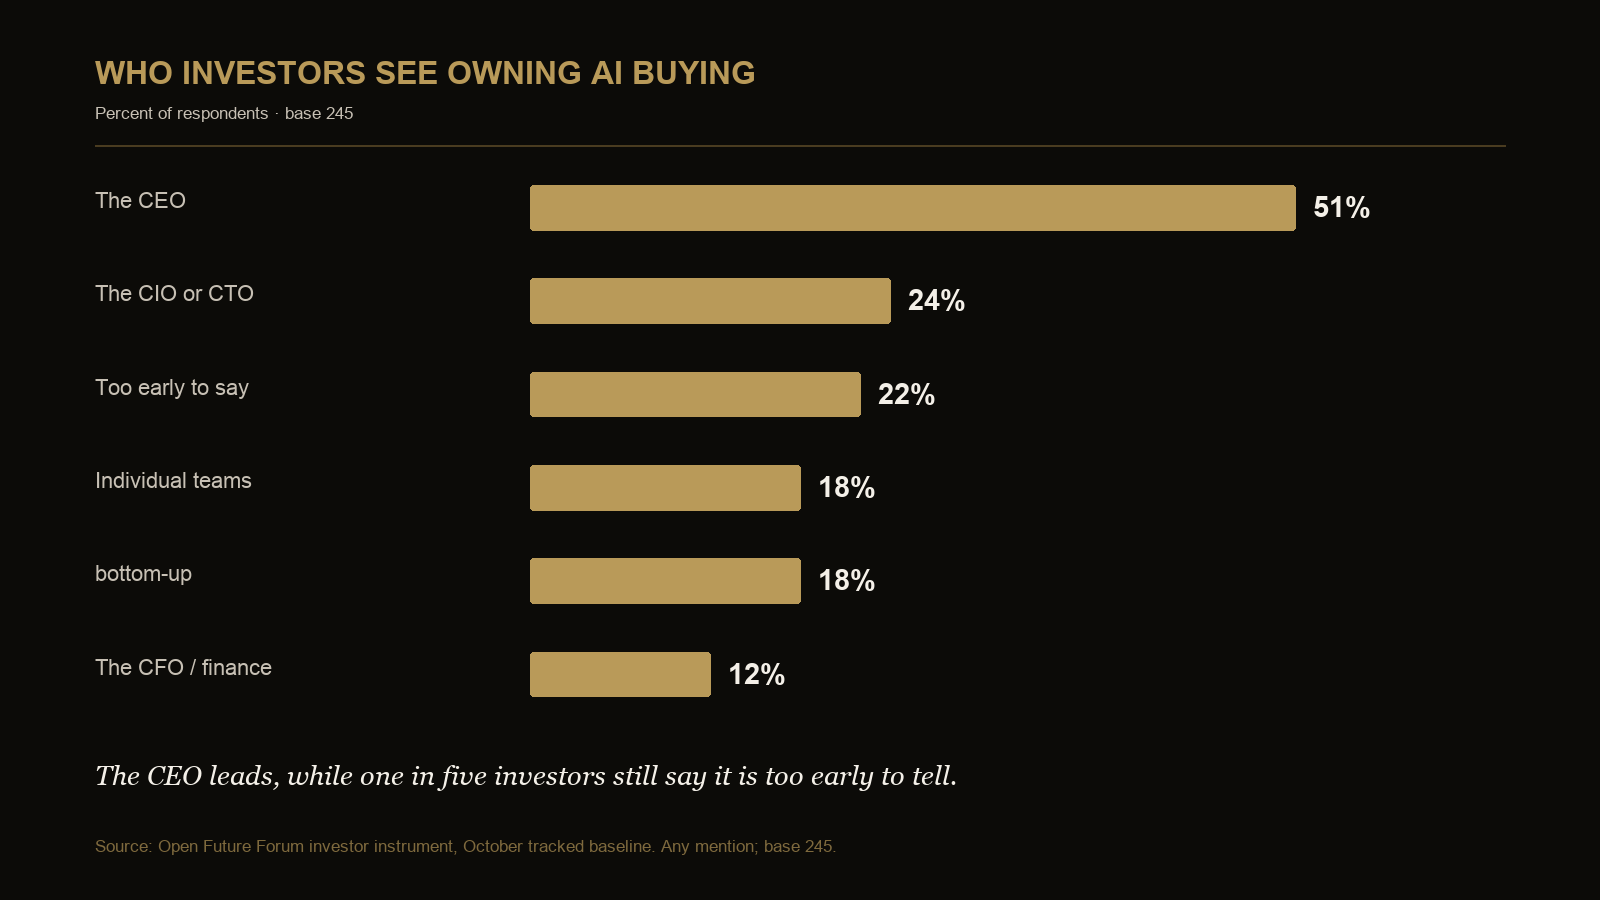
| Emerging owner across portfolios | Count | Share |
|---|---|---|
| CEO | 124 | 51% |
| CIO or CTO | 59 | 24% |
| Too early to say | 53 | 22% |
| Individual teams, bottom-up | 45 | 18% |
| CFO or finance | 30 | 12% |
Base 245; any mention, so shares can sum above 100 percent.
The CEO appears in 124 of 245 answers. At the same time, 53 respondents say it is too early to identify an owner, while the single “Individual teams, bottom-up” option appears 45 times. The baseline supports a top-down ownership signal without implying that buying has converged on one model.
Ownership by investor seniority
| Investor seniority | Base | CEO | CIO or CTO | Finance | Too early | Teams, bottom-up |
|---|---|---|---|---|---|---|
| Partner, founder or C-suite | 154 | 61% | 22% | 12% | 17% | 12% |
| VP, principal, director or head | 19 | 32% | 58% | 11% | 26% | 32% |
| Other titled respondent | 72 | 33% | 19% | 14% | 31% | 29% |
Title classification by keyword; any mention. The 19-person middle group is directional.
Partners, founders and C-suite investors name the CEO in 61 percent of answers, compared with 33 percent among other titled respondents. The 19-person middle group names the CIO or CTO most often, but its small base does not support a broad conclusion about the category.
Where investors report measurable impact
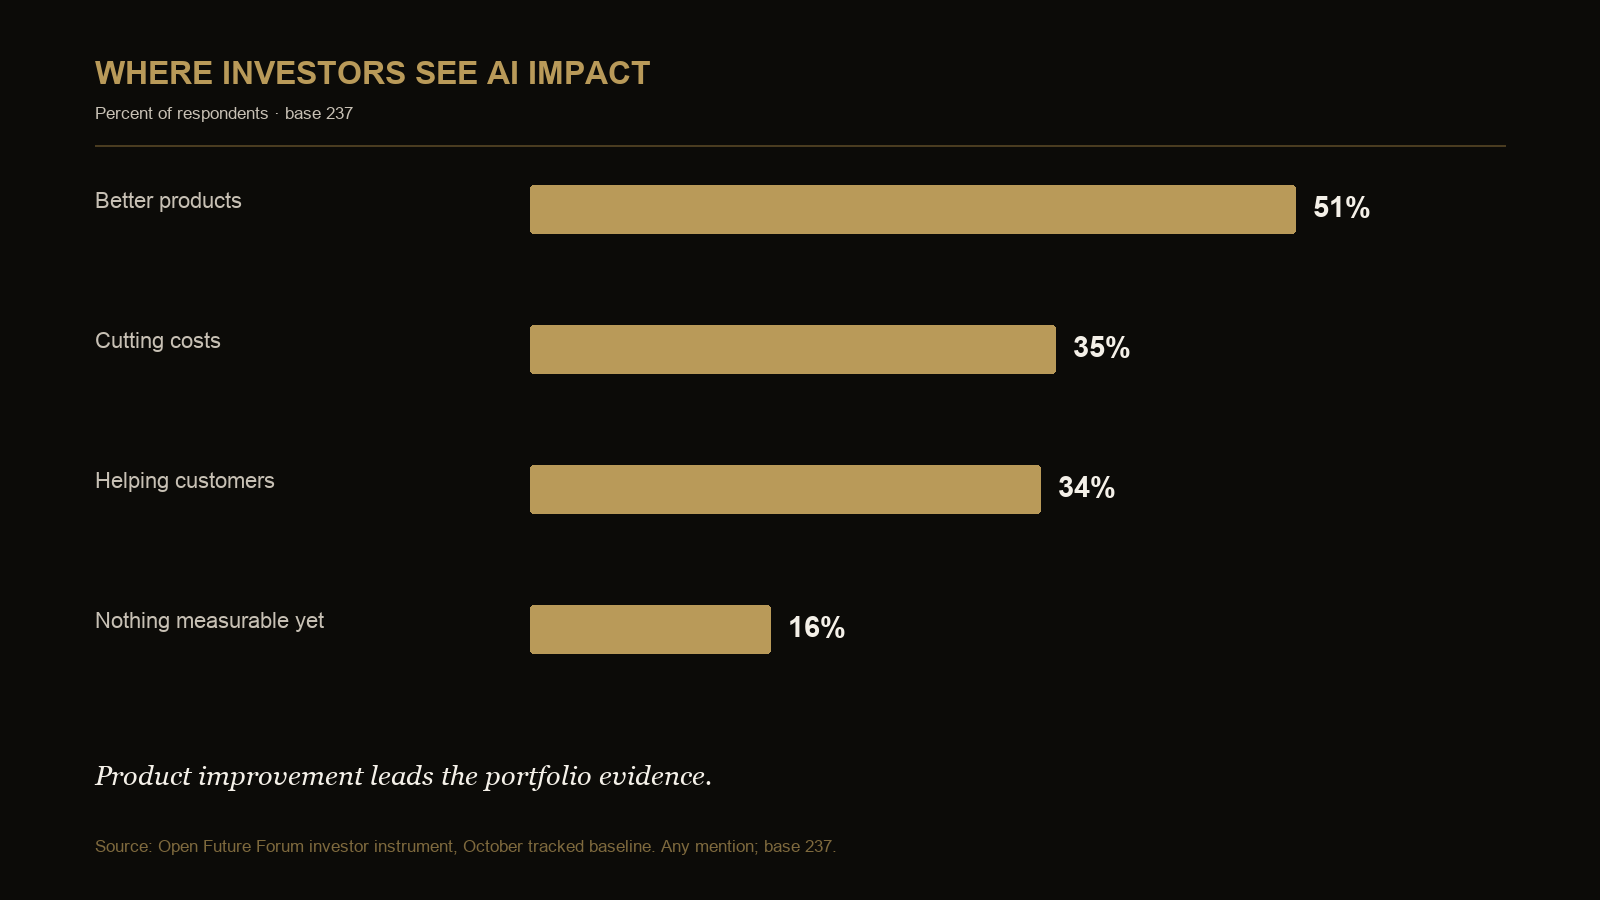
| Reported portfolio impact | Count | Share |
|---|---|---|
| Better products | 122 | 51% |
| Cutting costs | 83 | 35% |
| Helping customers | 81 | 34% |
| Nothing measurable yet | 37 | 16% |
Base 237; any mention, so shares can sum above 100 percent.
Better products lead, with cost reduction and customer help forming a second group. Two hundred five of 237 respondents select at least one of the three positive impacts.
That 86 percent is calculated respondent by respondent. It is not the arithmetic complement of “nothing measurable yet,” because five respondents select that option alongside at least one positive answer. The overlap is a reminder that multi-select responses can contain mixed portfolio experiences.
The product thesis and the cost thesis are different
Better products lead the impact distribution, but a product thesis requires more than product activity. An investment committee should specify the mechanism: capability unavailable before AI, improved quality, faster iteration, higher willingness to pay, stronger retention or a defensible data or workflow advantage. The survey does not distinguish among those mechanisms.
The cost thesis asks a different set of questions. Cost reduction can arise from labor capacity, automation, infrastructure optimization or a redesigned process, but it can also be offset by inference, integration, review and exception costs. The 35 percent answer shows that respondents report cost effects across portfolios; it does not quantify savings or establish that savings reached EBITDA.
| Thesis | Evidence the baseline supplies | Company evidence still required | Disconfirming signal to watch |
|---|---|---|---|
| Better product | Most-named impact at 51% (122 of 237) | Feature-level adoption, quality, customer outcome, pricing or retention evidence | Usage without customer value, low differentiation or a feature that competitors can reproduce easily |
| Lower cost | Named by 35% (83 of 237) | Before-and-after workflow cost including model, infrastructure, review and exception handling | Savings that disappear after full delivery cost or create unacceptable quality loss |
| Customer help | Named by 34% (81 of 237) | Baseline, attributable customer outcome and connection to renewal, expansion or price | A favorable story without a measurable customer decision or economic consequence |
Product improvement and cost reduction can coexist, but they should not be collapsed into a generic “AI value” claim. One may support growth, differentiation or pricing; the other may support margin, capacity or operating leverage. The evidence, time horizon and failure condition differ.
Impact by investor seniority
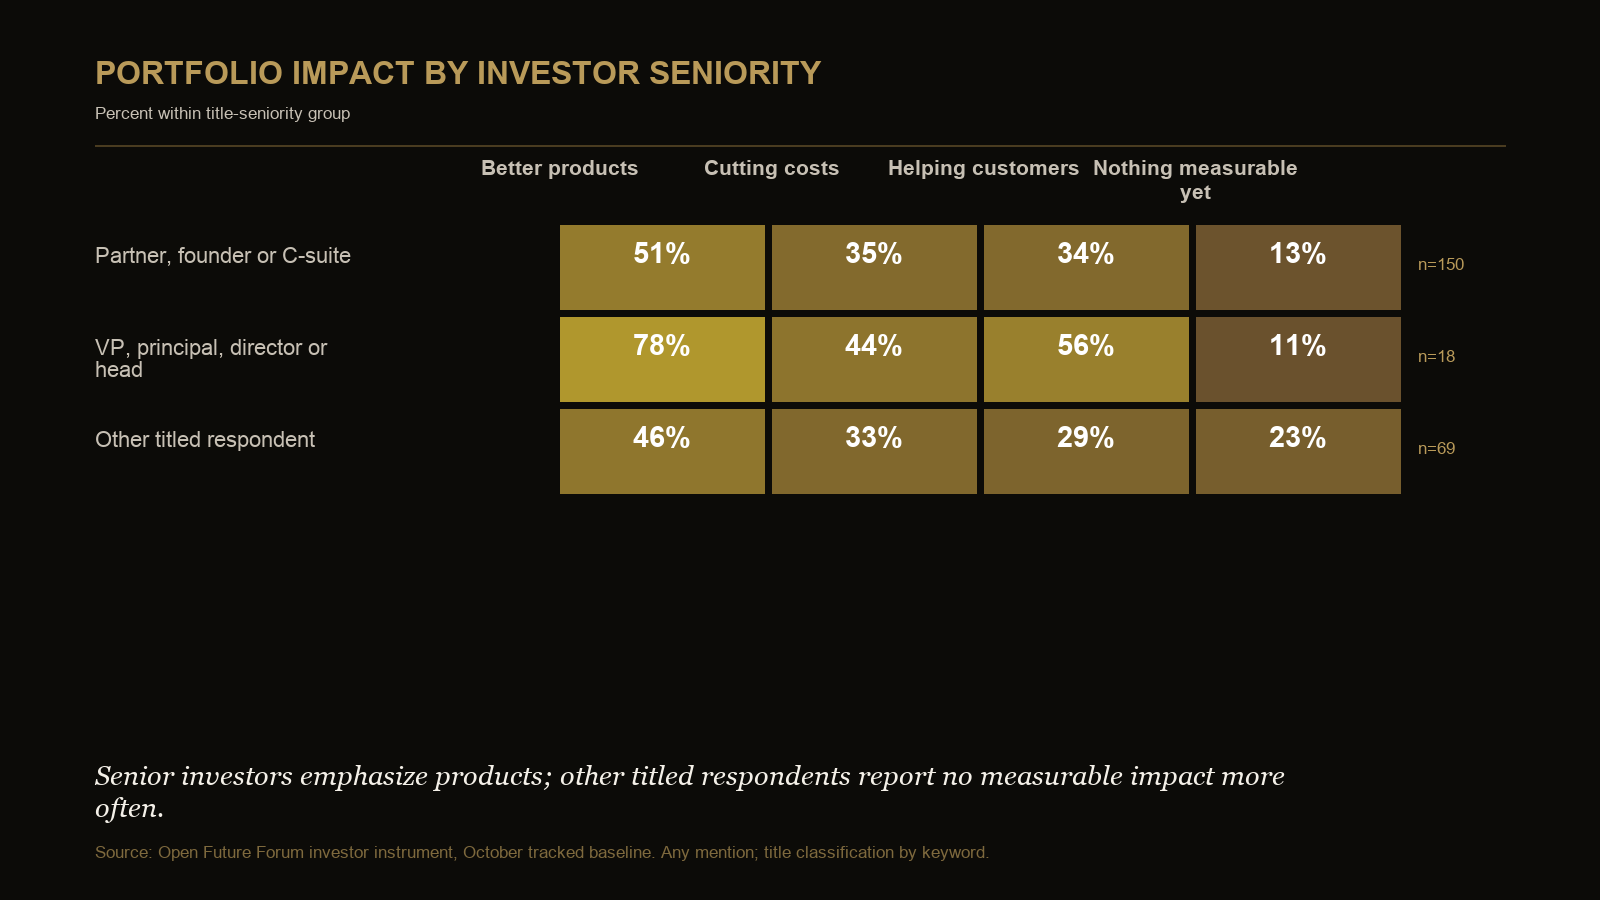
| Investor seniority | Base | Better products | Cost reduction | Customer help | Nothing measurable |
|---|---|---|---|---|---|
| Partner, founder or C-suite | 150 | 51% | 35% | 34% | 13% |
| VP, principal, director or head | 18 | 78% | 44% | 56% | 11% |
| Other titled respondent | 69 | 46% | 33% | 29% | 23% |
Title classification by keyword; any mention. The 18-person middle group is directional.
Partner, founder and C-suite responses closely resemble the overall impact pattern. The other-titled group reports “nothing measurable” in 23 percent of answers, compared with 13 percent among the senior group. The middle row is too small to treat its higher positive shares as a stable seniority effect.
Ownership and reported impact: a matched association
For 234 respondents who answered both questions, impact can be displayed within each named ownership answer. Ownership columns overlap because respondents could select more than one role; impact answers also overlap.
| Named emerging owner | Ownership base | Better products | Cost reduction | Customer help | Nothing measurable |
|---|---|---|---|---|---|
| CEO | 118 | 62% | 37% | 31% | 9% |
| CIO or CTO | 57 | 58% | 53% | 44% | 5% |
| Individual teams, bottom-up | 41 | 46% | 44% | 37% | 20% |
| CFO or finance | 29 | 48% | 48% | 48% | 7% |
| Too early to say | 49 | 33% | 22% | 35% | 41% |
Matched respondents answering both multi-select questions; base 234. Each ownership column uses any mention and can overlap another column. The 29-person finance group is directional.
The “too early to say” group reports nothing measurable in 20 of 49 answers, while the CEO group does so in 11 of 118. Better products appear in 73 of 118 CEO-owner answers and 33 of 57 CIO-or-CTO-owner answers. These are associations in a selective, cross-sectional sample. They do not show that executive ownership caused impact, that reported impact caused ownership to centralize or that the named roles operated in the same portfolio companies where impact occurred.
The disciplined thesis use is to ask whether ownership clarity and measurement develop together within a specific company. An investor would still need company-level decision rights, workflow records and outcome evidence before accepting that proposition.
Investment-thesis evidence table
Use this table to distinguish what the survey supports from what an investment committee would still need to establish. It is a thesis-development tool, not a portfolio operating checklist.
| Thesis proposition | Signal in this baseline | Supported reading | Evidence still needed before adopting the thesis |
|---|---|---|---|
| AI value is product-led | Better products lead at 51% (122 of 237) | Product improvement is the most frequently reported impact | Which product categories, customer segments and value mechanisms account for the signal |
| Efficiency remains investable | Cost reduction is named by 35% (83 of 237) | Efficiency is material but less frequently named than product improvement | Whether savings are durable, incremental and reflected in company economics |
| Customer-facing value matters | Helping customers is named by 34% (81 of 237) | Customer benefit is a distinct impact channel | How the benefit is measured, attributed and converted into retention, expansion or price |
| Evidence is not universal | Nothing measurable is named by 16% (37 of 237) | A meaningful minority still reports no measurable result | Which stages, sectors or use cases explain the absence of evidence |
| Buying is becoming executive-led | CEO is named by 51% (124 of 245) | Senior ownership is a prominent route in the investor view | Whether ownership differs by company size, purchase type, sector or maturity |
| Ownership remains unsettled | Too early is named by 22% (53 of 245) | The market has not converged on one buying model | What conditions move ownership toward the CEO, technology, finance or teams |
The baseline can identify promising propositions and uncertainty. It cannot, on its own, establish market size, causal returns, sector winners or a portfolio company's operating quality.
Failure modes in turning the baseline into a thesis
Converting frequency into magnitude
“Better products” is selected more often than “cutting costs,” but the instrument does not measure dollars, return, duration or strategic importance. A less frequent cost result could be economically larger than a more frequent product result. Thesis sizing requires company and market evidence beyond this distribution.
Treating ownership as convergence
The CEO leads, yet “too early” and the combined “Individual teams, bottom-up” answer remain material, and multi-select responses permit more than one owner. A fund should identify the conditions under which buying centralizes rather than assume every market will follow the same route.
Reading a seniority cut as expertise
Title groups may see different parts of the portfolio, use different definitions or have different response tendencies. The small middle rows are especially unstable. Use a difference to design follow-up diligence, not to rank which title is right.
Accepting an impact label without an evidence chain
The portfolio claim should connect company, workflow, baseline, current result, attribution method and economic consequence. If one link is missing, label it as an evidence gap rather than converting a broad investor perception into a verified company outcome.
How VC and CVC readers should use the seniority cuts
Seniority cuts are most valuable as a disagreement map. A difference can show where to ask another question; it should not automatically become a thesis. The partner, founder and C-suite rows have the strongest bases. The 18- and 19-person middle rows should be treated as prompts for future fieldwork, not estimates of a wider investor population.
For corporate venture teams, the ownership result also deserves care. “Who increasingly owns AI buying” is a perception across portfolios, not a record of who signs a specific purchase inside the respondent's own corporation.
What this means for investment committees
Write the AI thesis as a chain of testable propositions. Start with the reported signal (product, cost or customer impact), then state the missing market evidence and the observation that would disconfirm the claim. Keep perceived buying ownership separate from measured impact, and keep both separate from company-level operating diligence.
Implications for the investment ecosystem
For portfolio teams
Use the baseline to prioritize questions, then return to company records. For a product thesis, request adoption, quality, customer value and monetization evidence. For a cost thesis, reconcile gross savings to full workflow delivery cost. For ownership, document who proposes, funds, approves, operates and can stop the system.
For limited partners
Ask how the manager defines and verifies AI exposure and value across the portfolio. A count of AI companies or positive-impact selections is not a return attribution. Useful reporting separates thesis, company evidence, realized operating result, valuation assumption and remaining uncertainty.
For founders raising capital
Choose the value argument the evidence can sustain. If the advantage is product-led, show what customers can do now, how they behave differently and why the capability is defensible. If it is cost-led, show full delivery economics at current and expected scale. Do not use broad market adoption as a substitute for company-specific proof.
External context matrix
| External source | Relevant context | What Open Future Forum adds | Boundary |
|---|---|---|---|
| McKinsey, State of AI 2026 | Broader evidence on AI scaling, operating practices and uneven financial impact | Investor-reported product, cost and customer impact distributions plus matched ownership associations | Different populations and questions; percentages should not be pooled |
| McKinsey, generative AI in private markets | Context on the use and evidentiary limits of AI in private-market work | A thesis-evidence table that separates reported signals from the records an investment committee still needs | External guidance does not validate respondent claims or predict returns |
These sources provide context only. Their publisher is not affiliated with this report and does not endorse it.
Questions this report answers
Which reported AI impact leads the investor baseline?
Better products lead at 51 percent, followed by cost reduction at 35 percent and customer help at 34 percent (base 237, any mention).
Does 86 percent equal 100 percent minus “nothing measurable”?
No. The 86 percent figure is calculated directly: 205 of 237 respondents select at least one positive impact. Five respondents also select “nothing measurable,” so subtracting 16 percent from 100 would not reproduce the respondent-level measure. It is not a return, realization, sentiment or value-magnitude measure.
Who do senior investors see owning AI buying?
Among 154 partner, founder and C-suite respondents, 61 percent name the CEO, 22 percent the CIO or CTO and 17 percent say it is too early (any mention).
Do the seniority tables prove that job level causes a different view?
No. They are descriptive keyword-classified cuts. The VP, principal, director or head rows have bases of 19 for ownership and 18 for impact and are directional.
Does this edition show October movement?
No. No new comparable investor instrument was fielded, so the figures are carried forward from the latest baseline.
How is this different from the Investor AI Report?
This report develops the VC and CVC investment thesis from perceived ownership, impact and seniority. The Investor AI Report owns portfolio-company operating diligence and the evidence requested from management.
Does the matched ownership table show that CEO ownership creates product impact?
No. It shows association among 234 respondents answering both multi-select questions. Ownership groups overlap, portfolio companies are not matched and the data is cross-sectional, so direction and causality cannot be established.
Key citable facts
- Fifty-one percent of investors name the CEO as the role increasingly owning AI buying across portfolios (124 of 245, any mention).
- Better products are the most-named measurable portfolio impact at 51 percent (122 of 237, any mention).
- Eighty-six percent, or 205 of 237 respondents, select at least one positive measurable impact.
- Among partner, founder and C-suite respondents, 61 percent name the CEO as an emerging owner (base 154, any mention).
- The ownership and impact figures are carried forward and do not measure October movement.
Methodology and honesty notes
Investor ownership and impact questions come from the latest comparable investor instrument. No new comparable instrument was fielded in October, so the results are a retained baseline rather than a month-on-month comparison. Respondents are deduplicated by email for each question, with the latest answer retained. Both questions allow multiple selections and use the any-mention convention.
The 86 percent positive-impact measure is calculated at respondent level as the share selecting better products, cutting costs or helping customers (205 of 237). It is not calculated as the complement of “nothing measurable,” because five respondents selected that option alongside at least one positive answer.
The ownership-by-impact table contains 234 respondents who answered both multi-select questions. Each ownership column uses any mention and may overlap another ownership column; impact answers also overlap. The finance ownership group has a base of 29 and is directional. The table describes associations only and does not connect a named owner to a specific portfolio company, establish direction or support a causal claim.
Seniority groups are classified from titles by keyword. The VP, principal, director or head groups have bases of 19 for ownership and 18 for impact and are directional. Results describe investor perceptions across portfolios; they do not verify individual company outcomes, causal returns or future investment performance.
Related reading
- Investor AI Report: portfolio operating diligence and evidence requests
- YC Founder AI Report: founder pricing and the enterprise buying doorway
- Executive AI Statistics: complete source tables and methodology
- Who Owns the AI Buying Decision Across Investor Portfolios?
- What Share of Portfolios Show Measurable AI ROI?
Citation and editions
Suggested citation: Newlands, M. (2026). VC and CVC AI Investment Report, Edition 3. Open Future Forum, October 2026. This edition supersedes Edition 2, September 2026.
Work These Questions with Investor Peers
Forum Select meets through small, off-the-record gatherings. Membership is by application and referral.