Answer in one sentence: Investors should require a portfolio company to produce an ownership record and workflow-level proof of value for every material production AI system, not treat deployment or agent count as evidence of operating leverage.
What this report owns
This report is an operating-diligence guide for existing portfolio companies. The companion VC and CVC AI Investment Report owns investment-thesis interpretation, reported portfolio impact and investor-seniority analysis. This page focuses on the records an investor should be able to request after capital is committed.
Key October evidence
- Fifty-one percent name the CEO as the role increasingly owning AI buying; 24 percent name the CIO or CTO, and 22 percent say it is too early to tell (base 245, any mention; carried forward).
- Eighty percent of AI Leaders respondents report at least one production agent (base 75), while 44 percent report full real-time AI cost visibility (base 77). The 36-point difference compares separate questions from the same event; it is not a matched-respondent statistic.
- Among applicable AI Leaders responses, 37 percent use shared service accounts for agent data access (base 49).
- Data access and quality is the most-named production bottleneck at 39 percent (base 75, any mention).
Evidence sources: See the VC and CVC AI Investment Report for investment-thesis interpretation, the AI Leaders AI Leverage Report for production evidence and Executive AI Statistics for complete distributions and provenance.
The carried-forward portfolio-impact distribution and seniority cut remain useful context, but they belong in the VC and CVC report. This report does not reproduce that owner-and-value thesis; it starts with the operating records needed to test a claim at an individual portfolio company.
What changed in October, and what did not
October adds a production-operations lens to the carried-forward investor baseline. The new evidence does not show that investor opinion moved during the month: no comparable investor instrument was fielded. It shows what an investor can now ask a portfolio company to substantiate. In the AI Leaders cohort, production agents are common, but cost visibility and access design vary. Those operator responses make the diligence question more precise: not simply “Are you using AI?” but “Can you connect a production system to a responsible owner, an attributable identity, a full cost and a measured result?”
Three boundaries matter when reading the report:
- Investor view: ownership and impact figures describe a carried-forward investor instrument. They are useful as a reference point, not a monthly trend.
- Operator evidence: fleet, cost, bottleneck and access figures describe a separate AI Leaders cohort. They identify likely evidence gaps but do not estimate their prevalence in an investor's portfolio.
- Recommended practice: the register, cadence and review tests below are Open Future Forum diligence tools. They are not claims that respondents already follow them.
The distinction prevents a familiar analytical mistake: combining separate samples into a synthetic journey. A portfolio company with production agents is not necessarily one of the companies considered by the investor respondents, and the October operator figures cannot be used to infer returns for the carried-forward portfolio sample.
Definitions for portfolio review
| Term | Working definition in this report | What it does not mean |
|---|---|---|
| Production AI system | A model, agent or AI-enabled workflow performing a live business task for internal or external users | A demo, isolated experiment or approved vendor that is not in use |
| Material workflow | A workflow whose financial, customer, regulatory, data or operational exposure warrants explicit review | Every low-risk productivity use by an individual |
| Workflow owner | The person accountable for the operating result and the decision to continue, change or stop the workflow | Necessarily the executive who approved the purchase |
| Full run cost | Model, infrastructure, tooling, integration, monitoring, human review and control cost attributable to the workflow | The vendor invoice alone |
| Evidence of value | A defined baseline, result, measurement window and evidence owner attached to the same workflow | A general productivity claim or an agent count |
| Control exception | An approved or discovered departure from the standard access, data, review or operating pattern | Automatically a legal violation or security incident |
These definitions allow an investor and management team to use the same vocabulary. Without them, “in production,” “owner,” “cost” and “ROI” can change meaning from one portfolio review to the next.
Ownership is the first evidence test
The VC and CVC report contains the full carried-forward ownership exhibit. Its practical implication for operating diligence is that purchase approval and post-purchase accountability need separate records. The person who signs can authorize spend without owning the data, technical operation, control evidence or measured result.
A portfolio review should therefore identify at least four roles: the executive sponsor who approves direction and resources; the business owner accountable for the workflow result; the technical owner accountable for the deployed system; and the control owner accountable for the relevant access, monitoring and exceptions. One person can hold more than one role, but the allocation should be deliberate and reviewable. When authority is distributed, the record should also state who resolves disagreement and who can pause or retire the system.
Portfolio AI evidence register
Use one row per material AI workflow or agent. “Material” should be defined by the company in relation to financial exposure, customer impact, regulated data, operational dependency or contractual commitment.
| Register field | Minimum record | Diligence test |
|---|---|---|
| Workflow and purpose | Named process, users and intended result | Can management identify the decision or task the system changes? |
| Decision rights | Executive sponsor, business owner, technical owner and control owner | Are approval, operation and oversight assigned separately? |
| System record | Vendor, model, tools, version or material configuration, and production date | Can the deployed system be distinguished from a pilot or an earlier version? |
| Identity and access | Credential type, approved data scope, actions permitted and revocation owner | Can actions be attributed and access removed promptly? |
| Cost record | Model, infrastructure, tooling, integration, review and control costs by workflow | Can finance reconcile total run cost to the workflow? |
| Value record | Baseline, outcome measure, measurement window and named evidence owner | Is the claimed benefit observable and repeatable? |
| Exceptions and incidents | Approved exceptions, failures, overrides and remediation status | Can the company show what happened when the system departed from plan? |
| Review decision | Last review date, reviewer and continue, change or stop decision | Does the record lead to an operating decision? |
The register is complete only when ownership, economics, access and outcome evidence refer to the same deployed workflow. A company-wide AI budget, a vendor invoice or an aggregate agent count cannot substitute for that link.
For a cross-company method that normalizes evidence, flags concentration and converts exceptions into capital or operating action, use How Should Investors Run Quarterly AI Triage Across a Portfolio?
Investor and partner self-check
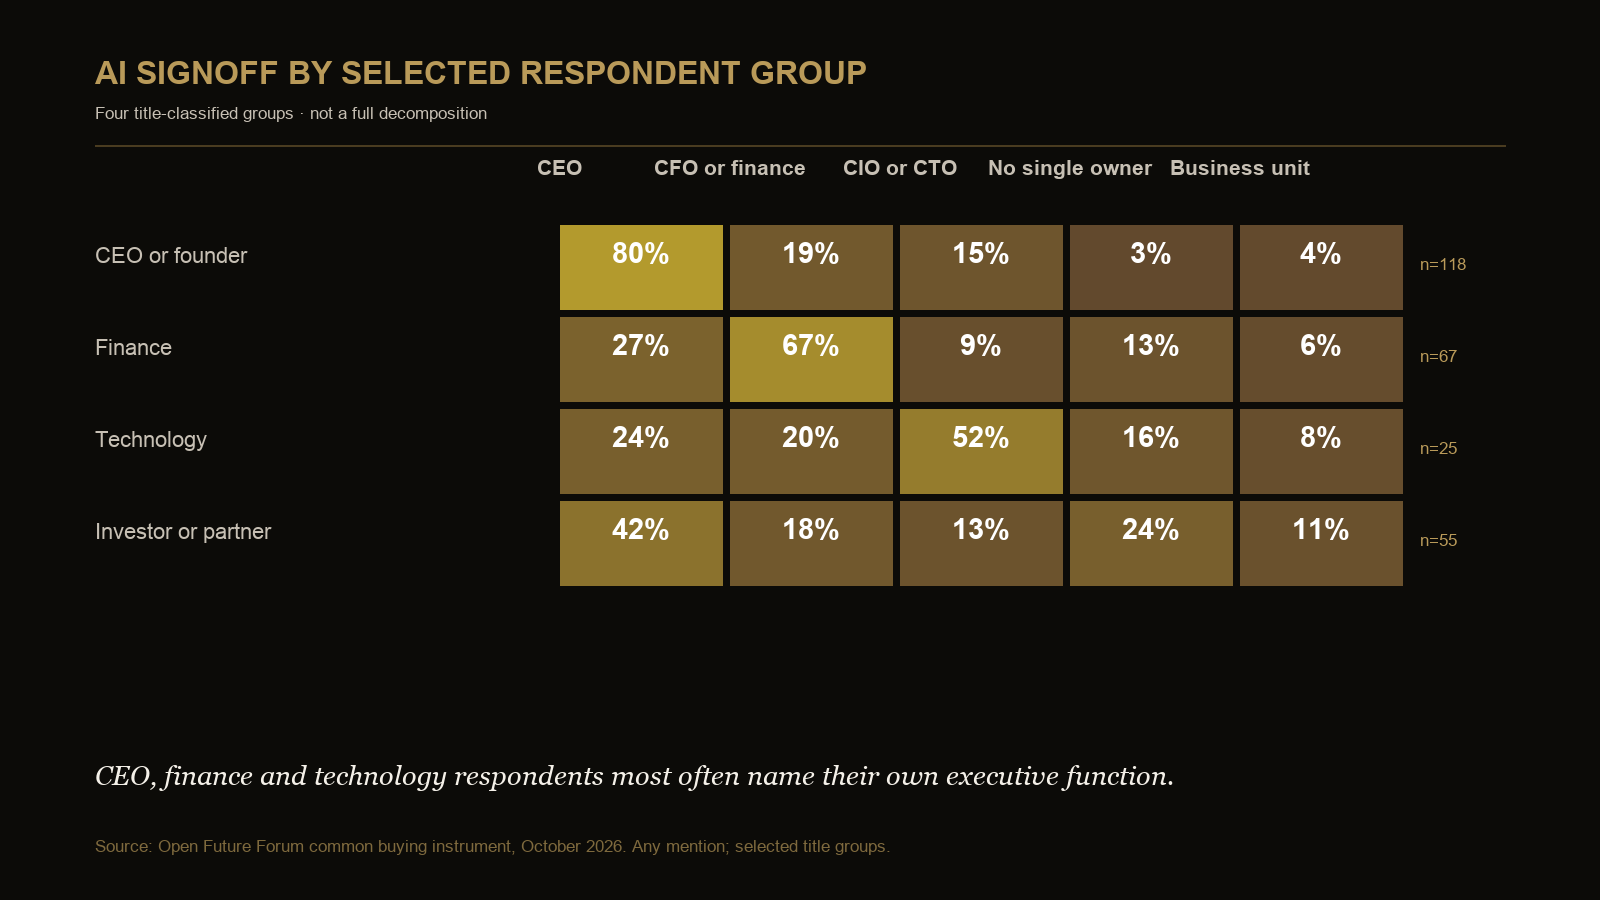
The title-classified cut provides a useful mirror for investors' own portfolio-review assumptions. Among 55 common sign-off respondents classified as an investor or partner, 42 percent name the CEO, 24 percent say there is no single owner, 18 percent name finance, 13 percent name the CIO or CTO and 11 percent name a business unit (any mention). Among 49 investor-or-partner respondents to the finance instrument, 43 percent mention net-new money and 43 percent mention no clear AI budget; 12 percent mention money that would otherwise have gone to headcount and 10 percent mention software reallocation. These are title-keyword cuts, and the categories are non-exclusive where the underlying question is multi-select.
| Self-check question | Relevant investor-or-partner cut | Review implication |
|---|---|---|
| Do we know who can approve the purchase? | CEO 42%; no single owner 24% (base 55) | Record approval authority separately from workflow ownership |
| Can we identify a durable funding source? | Net-new 43%; no clear budget 43% (base 49) | Test whether recurring costs have a budget after the pilot period |
| Is proof of value the gating issue? | Proving ROI 51% (25 of 49) | Agree the baseline and decision rule before adding more capital |
| Are security questions economically relevant? | Security and compliance 29% (14 of 49) | Put remediation and recurring control cost in the value case |
| Is the expected proof window explicit? | Under six months 37%; six to twelve months 29%; not sure 22% (base 49) | Match the review date to the workflow's realistic time to evidence |
These cuts are not a scorecard for the investment industry. They are a prompt to test whether the investor's own review process asks for more precision than the market language it encounters. A “no clear budget” response can coexist with a funding-source answer because the instrument allowed multiple selections; it should not be recoded as an exclusive budget state.
Control evidence to request
| Evidence question | October operator signal | What the portfolio company should produce |
|---|---|---|
| Is AI operating in production? | 80% report at least one production agent (base 75) | Current production inventory and workflow owner |
| Is run cost observable? | 44% report full real-time visibility; 39% partial; 17% none (base 77) | Workflow cost ledger and allocation method |
| Are actions attributable? | 37% use shared service accounts among applicable responses (base 49) | Credential map, access logs and revocation procedure |
| What limits scale? | 39% name data access and quality (base 75, any mention) | Data dependencies, quality controls and unresolved exceptions |
These operator figures come from a separate cohort and are not combined statistically with the investor results. They identify evidence to request, not the prevalence of a control problem in any particular portfolio.
A practical review sequence
- Select the material workflows that management says create revenue, reduce cost or improve customer outcomes.
- Match each claim to one row in the evidence register.
- Reconcile the claimed result with the full workflow cost and measurement window.
- Trace authorization, identity, data scope and exceptions for the same system.
- Record the investor or board decision: continue, change controls, fund remediation or stop.
This sequence separates three questions that are often collapsed: whether AI exists, whether it is controlled and whether it creates durable value.
From diligence to the first 100 days
The evidence register should travel with the investment rather than end as a deal-team appendix. A practical cadence has three stages.
At underwriting or initial portfolio review
Start with the workflows used in the investment case, management plan or board narrative. Establish which are actually in production, which are pilots and which remain proposals. For every material claim, record the baseline, owner, cost boundary, customer or operating outcome and principal control dependency. Any missing record should become an explicit diligence exception, not an unstated assumption inside a valuation or value-creation model.
The output should be a short list of verified claims, open claims and excluded claims. “Verified” means the evidence can be reproduced; it does not mean the result will persist. “Open” means a record or measurement window is incomplete. “Excluded” means the claim should not be used in the current case.
During the first 100 days
Convert open diligence items into owned operating work. Name the executive sponsor and workflow owner, create or update the production inventory, establish the cost-allocation rule and close high-priority access or logging exceptions. Rebaseline the value measure if the transaction, integration or operating plan changes the workflow. The first 100-day review should end with an explicit continue, constrain, remediate or stop decision for each material system.
This is also the point to separate a one-time integration expense from a recurring AI delivery or control cost. Combining them can understate the ongoing run rate or overstate a permanent burden. The record should show both.
At the quarterly portfolio review
Review changes, not just totals. Ask which systems entered or left production, which owners or vendors changed, which costs moved outside the expected range, which outcomes weakened and which exceptions remain open. A quarterly pack should include:
- the material production inventory and changes since the prior review;
- value evidence and full run cost for the workflows tied to the operating plan;
- incidents, overrides, unresolved access exceptions and remediation status;
- material vendor, model, data or contract changes; and
- the resulting capital and operating decision.
The cadence is deliberately decision-oriented. A register that grows every quarter but never causes a system to be changed, funded, constrained or stopped is documentation, not governance.
Common failure modes in portfolio reporting
| Failure mode | Why it creates false confidence | Corrective evidence |
|---|---|---|
| Counting agents as value | More agents can raise cost and control exposure without improving an outcome | Workflow-level baseline, result and full run cost |
| Treating approval as ownership | The signer may not operate or monitor the system | Separate sponsor, workflow, technical and control owners |
| Using a vendor bill as total cost | Integration, review, observability and control work can sit elsewhere | Reconciled workflow cost ledger |
| Calling avoided hiring a saving | A future plan is not the same as cash removed from the run rate | Approved hiring plan, capacity evidence and treatment rule |
| Averaging across unlike workflows | A strong low-risk use case can conceal a weak material one | Review at the workflow level before aggregation |
| Closing an exception without evidence | A status label does not show that access, logging or behavior changed | Completion test, owner, date and retained proof |
| Repeating a management estimate | An estimate can become a “fact” through repetition | Source system, calculation method and evidence owner |
Implications by stakeholder
- Investment partner: decide which claims can enter the investment or value-creation case and which remain management hypotheses.
- Operating partner: turn open diligence items into a sequenced 100-day plan with accountable owners and completion tests.
- Portfolio CEO: resolve decision rights and determine which workflows deserve further capital, constraint or retirement.
- Portfolio CFO: reconcile full run cost, funding source and benefit treatment so avoided cost, cash savings and revenue are not mixed.
- Technology and security leaders: maintain the system, identity, data, logging and exception evidence needed to support the operating claim.
- Board director: test whether the review pack leads to decisions and whether material changes or incidents reach the board at the right threshold.
The companion VC and CVC report addresses who owns buying and where investors report portfolio impact. This report deliberately stops at the operating evidence required after investment, so the two pages answer different questions.
Comparison with external research
| External source | Relevant context | How this report uses it |
|---|---|---|
| McKinsey's 2026 State of AI | Broad AI scaling coexists with limited enterprise-level financial impact and cost constraints for some organizations | Converts a broad value question into workflow-level ownership, cost and outcome evidence |
| NIST AI Risk Management Framework | Provides a general structure for governing and managing AI risk | Supports a repeatable review discipline; it does not replace company-specific diligence |
The external sources use different samples and purposes. They are context for the evidence design, not data to be pooled with the Open Future Forum instruments.
Questions this report answers
What operating evidence should investors require from a portfolio company using AI?
Require a workflow-level record showing decision rights, the deployed system, identity and data access, total run cost, the outcome measure, exceptions and the latest review decision.
How should an investor separate AI adoption from proof of value?
Treat production status and agent count as inventory measures. Proof of value requires the same workflow's baseline, measured result, measurement window and full cost record.
Which ownership record matters after an AI purchase is approved?
The record should distinguish the executive sponsor from the business, technical and control owners. Investor respondents most often name the CEO as the rising buying owner at 51 percent, but 22 percent say it is too early to tell (base 245, any mention; carried forward).
How often should investors review material production AI systems?
Use diligence to set the baseline, the first 100 days to close evidence and control gaps, and a quarterly review to examine changes in systems, costs, outcomes, incidents and exceptions. A material event should trigger an earlier review.
Can an AI benefit be counted when the company cannot allocate full run cost?
It can remain a management hypothesis, but it should not be treated as verified net value. Record the gross outcome separately and identify the missing model, infrastructure, review, integration or control cost needed for reconciliation.
Does a shared service account prove that a portfolio company has a control failure?
No. The access method is a diligence signal, not a conclusion. Examine whether actions remain attributable, privileges are scoped, logs are retained, credentials can be revoked and exceptions are reviewed.
What should happen when management cannot reproduce an AI value claim?
Classify the claim as open or excluded, state the missing evidence and assign a decision date. Do not allow an unsupported estimate to become a recurring portfolio fact merely because it appeared in an earlier presentation.
Key citable facts
- Fifty-one percent of investors name the CEO as the role increasingly owning AI buying across portfolios (base 245, any mention; carried forward).
- Eighty percent of AI Leaders respondents report at least one production agent (base 75), while 44 percent report full real-time AI cost visibility (base 77); these are separate questions from the same event.
- Shared service accounts are used by 37 percent of applicable AI Leaders respondents (base 49).
Methodology and limitations
This is an investor operating-diligence note, not a new investor survey. Investor ownership and portfolio-impact figures are carried forward and labeled. Operator figures come from a separate cohort and are not combined with investor results. The sample is selective and not a probability sample. Respondents are deduplicated by email for each question, invited-only rows are excluded, and multi-select questions use any mention. The evidence register and review sequence are recommended diligence tools, not survey findings.
Related reading
- VC and CVC AI Investment Report
- Private Equity AI Report
- Executive AI Statistics
- Who Owns the AI Buying Decision Across Investor Portfolios?
- What Share of Portfolios Show Measurable AI ROI?
- What Does the Buy Side Believe About AI ROI?
Citation
Suggested citation: Newlands, M. (2026). Investor AI Report, October 2026 data note. Open Future Forum.
Work These Questions with Investor Peers
Forum Select meets through small, off-the-record gatherings. Membership is by application and referral.