The October answer
Fifty-nine percent report AI deployed or embedded, but only 13 percent say removing it would change the cost structure or hiring plan. Production deployment is common; evidence of a changed operating model is not. The next step is to connect live systems to workflow, planning and control.
What changed since Edition 2
Edition 2 relied on proxy signals because the four-stage question did not yet exist. Edition 3 uses the direct maturity ladder from Enterprise AI at Microsoft and adds production-agent count and cost visibility. These measures distinguish deployment from broader operating change.
Where this research comes from
The maturity, agent and cost questions come from Enterprise AI at Microsoft. Funding, sign-off and blocker lines come from the common finance instrument. Security and marketing supply function-specific evidence. Respondents are deduplicated separately by email for each question.
The four stages
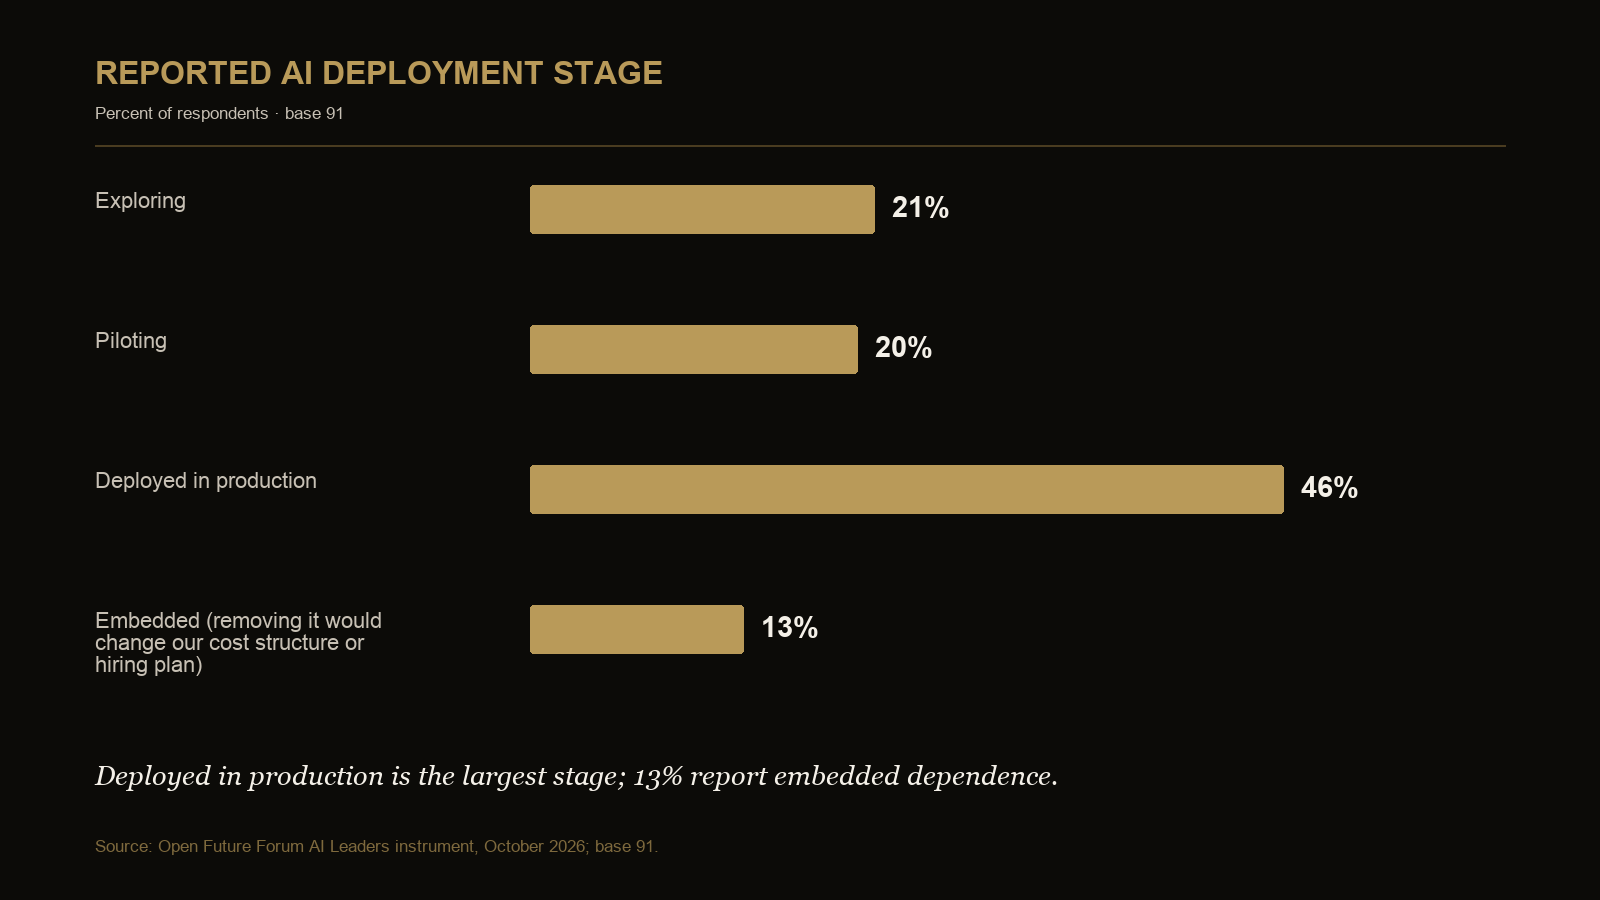
Exploring accounts for 21 percent, piloting 20, deployed 46 and embedded 13 (base 91). A system counts as embedded only when removing it would change the organization's cost structure or hiring plan.
Deployed and embedded in the October sample
The deployed share exceeds the embedded share by 33 points. This is a cross-sectional difference, not a conversion rate or a measure of movement over time. The definitions separate a live system from one that affects costs or hiring; the latter can involve workflow redesign, cost accounting, identity management, governance, reliability and workforce decisions.
Constraints associated with production
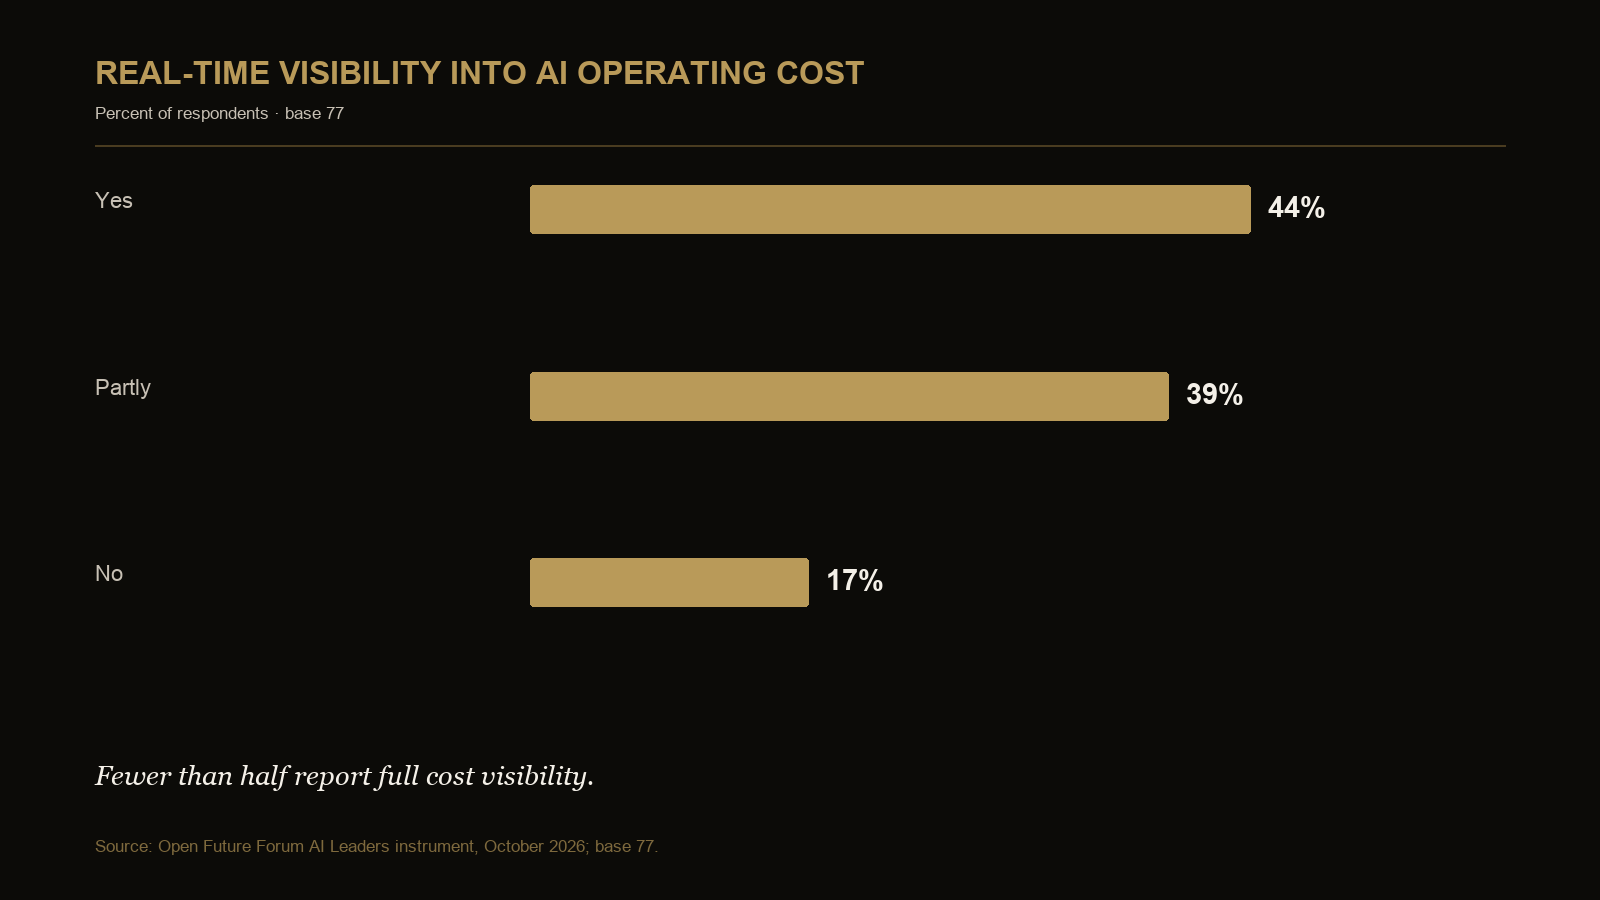
Four constraints recur in the data. Data access and quality is named by 39 percent, and integration by 28 percent. Only 44 percent have full cost visibility. In the security instrument, 68 percent name agent access as a problem while 34 percent report a dedicated security line.
October transformation evidence
Maturity measure: exploration through production
AI maturity
| Answer | Count | Share |
|---|---|---|
| Exploring | 19 | 21% |
| Piloting | 18 | 20% |
| Deployed in production | 42 | 46% |
| Embedded | 12 | 13% |
Base 91.
Fifty-nine percent are deployed or embedded, but only 13 percent meet the stricter embedded test. The 33-point difference between the deployed and embedded categories is descriptive; it should not be read as a transition or conversion rate.
Fleet measure: production-agent count
Production-agent count
| Answer | Count | Share |
|---|---|---|
| None | 9 | 12% |
| 1 to 5 | 27 | 36% |
| 6 to 20 | 11 | 15% |
| More than 20 | 22 | 29% |
| Not sure | 6 | 8% |
Base 75.
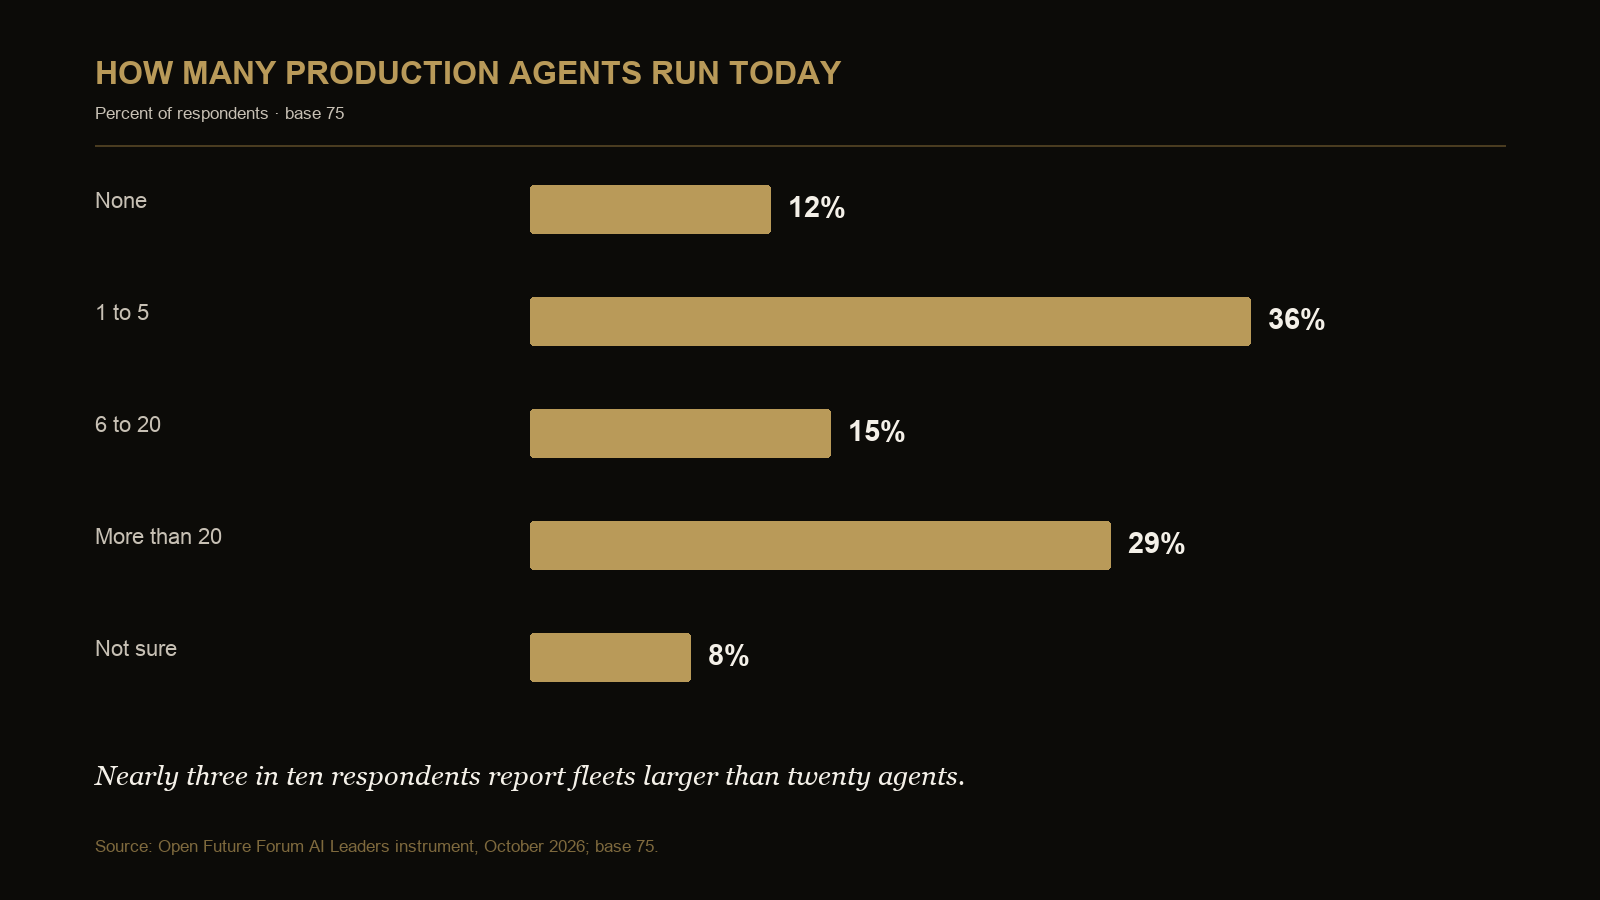
Sixty of 75 respondents report at least one production agent, and 22 report more than twenty. At that scale, cost tracking, identity management and observability are basic operating requirements.
Control measure: cost visibility
AI cost visibility
| Answer | Count | Share |
|---|---|---|
| Full real-time visibility | 34 | 44% |
| Partial visibility | 30 | 39% |
| No real-time visibility | 13 | 17% |
Base 77.
| Group | Base | Full visibility | Partial visibility | No visibility |
|---|---|---|---|---|
| Exploring | 18 | 22% | 33% | 44% |
| Piloting | 14 | 36% | 43% | 21% |
| Deployed in production | 33 | 61% | 33% | 6% |
| Embedded (removing it would change our cost structure or hiring plan) | 10 | 50% | 50% | 0% |
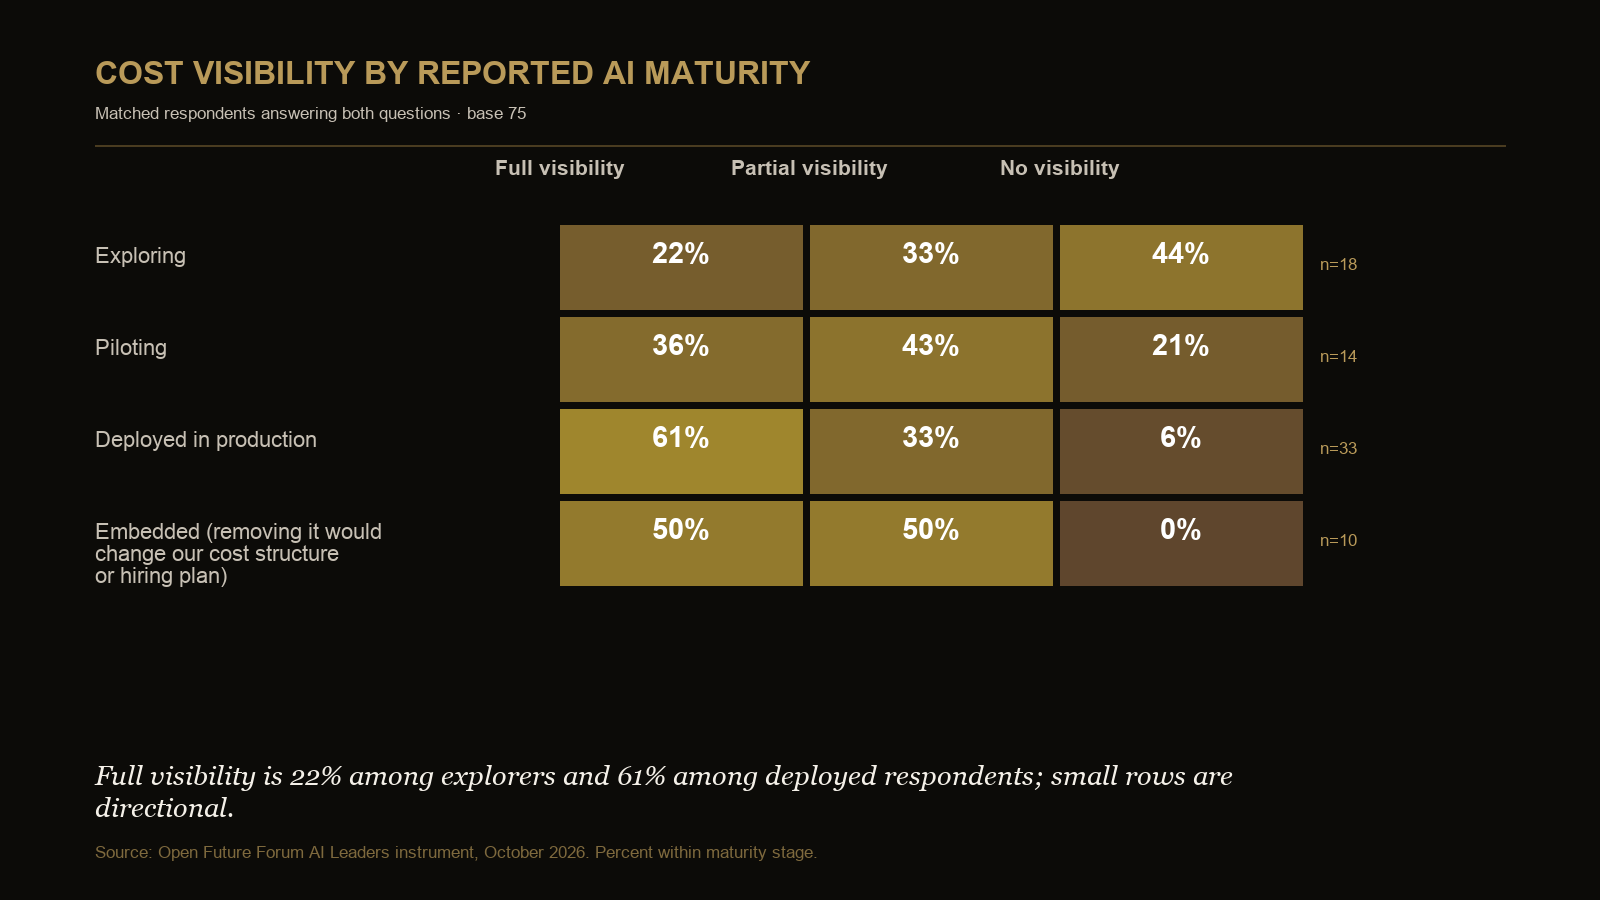
Matched respondents answering both questions; base 75. Small row bases are directional.
In the matched responses, 22 percent of explorers and 61 percent of deployed respondents report full visibility. None of the ten embedded respondents report having no visibility, though that row is too small for a firm conclusion. These cross-sectional differences do not show how any organization progressed from one stage to another.
Funding and production conditions
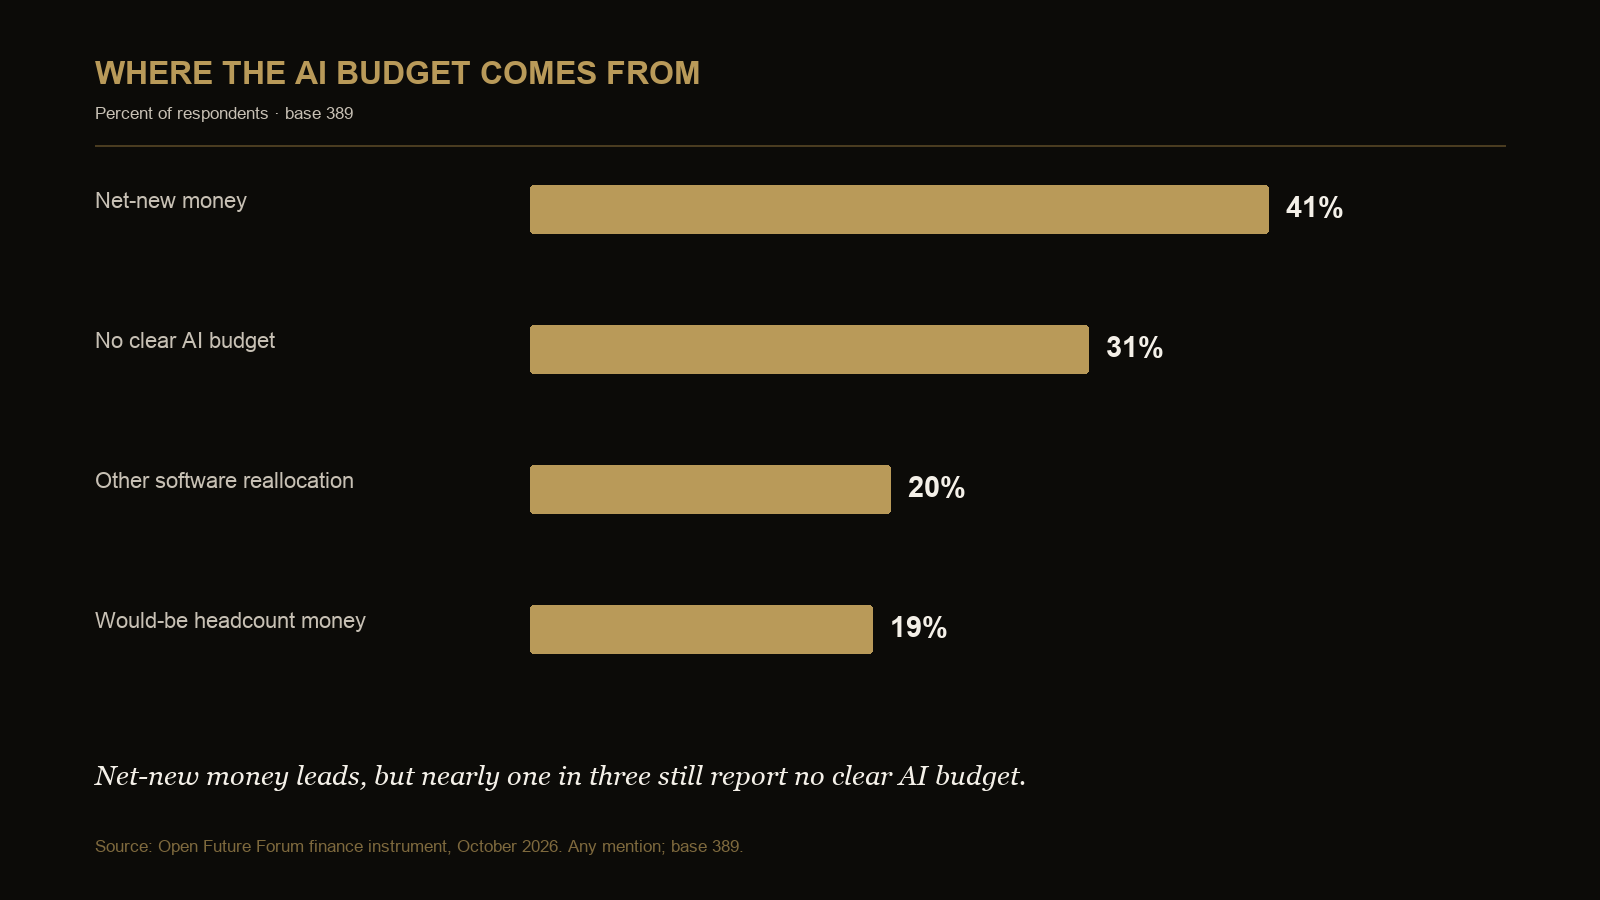
AI funding source
| Answer | Count | Share |
|---|---|---|
| Net-new money | 159 | 41% |
| No clear AI budget | 120 | 31% |
| Other software reallocation | 77 | 20% |
| Would-be headcount money | 73 | 19% |
Base 389; any mention, so shares can sum above 100 percent.
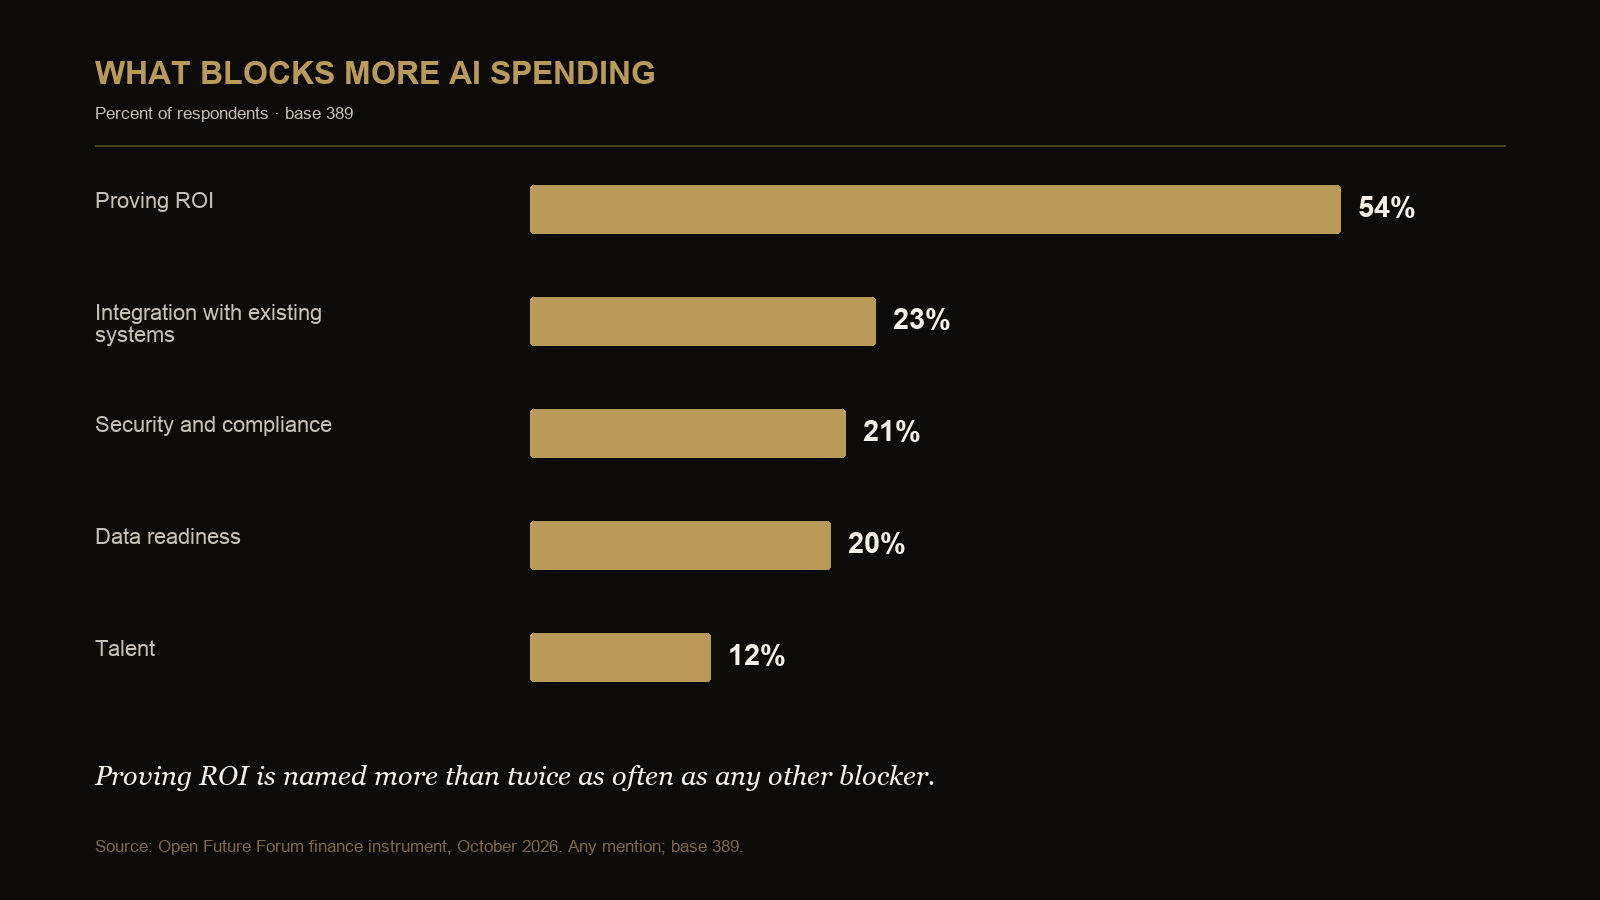
Spending blockers
| Answer | Count | Share |
|---|---|---|
| Proving ROI | 211 | 54% |
| Integration with existing systems | 89 | 23% |
| Security and compliance | 80 | 21% |
| Data readiness | 79 | 20% |
| Talent | 45 | 12% |
Base 389; any mention, so shares can sum above 100 percent.
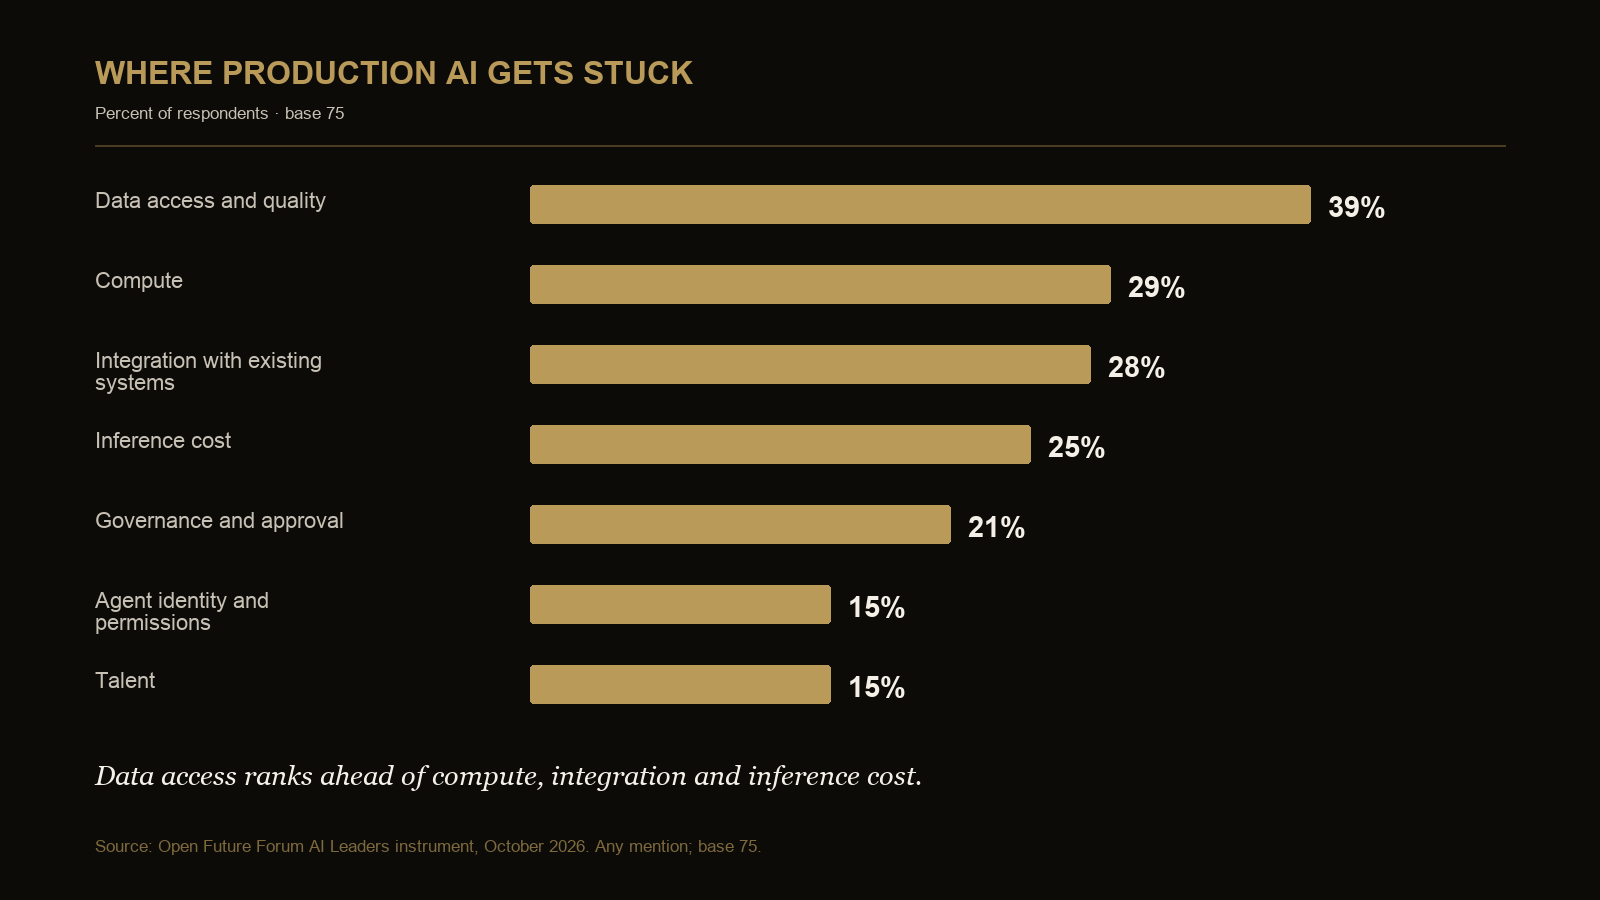
Production bottlenecks
| Answer | Count | Share |
|---|---|---|
| Data access and quality | 29 | 39% |
| Compute | 22 | 29% |
| Integration with existing systems | 21 | 28% |
| Inference cost | 19 | 25% |
| Governance and approval | 16 | 21% |
| Agent identity and permissions | 11 | 15% |
| Talent | 11 | 15% |
Base 75; any mention, so shares can sum above 100 percent.
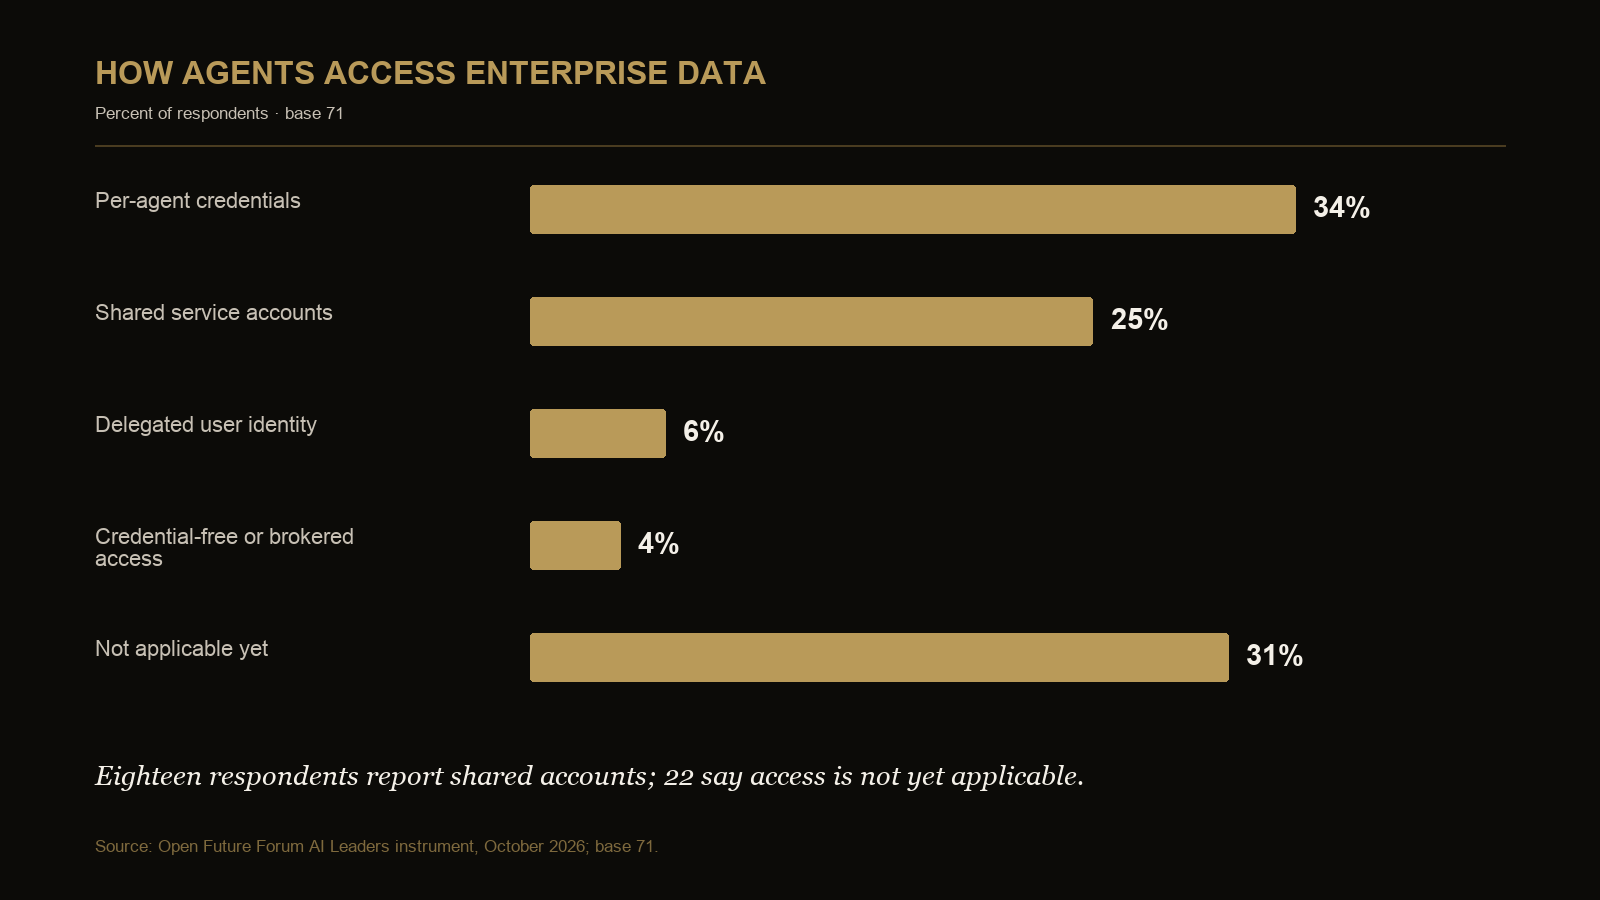
Agent access among applicable responses
| Answer | Count | Share |
|---|---|---|
| Per-agent credentials | 24 | 49% |
| Shared service accounts | 18 | 37% |
| Delegated user identity | 4 | 8% |
| Credential-free or brokered access | 3 | 6% |
Base 49.
The finance instrument shows where AI funding comes from and what prevents additional spending. The AI Leaders instrument identifies production bottlenecks and agent access methods. The cohorts are reported separately; the results should not be read as respondent-level relationships across the two instruments.
Descriptive control and funding comparisons
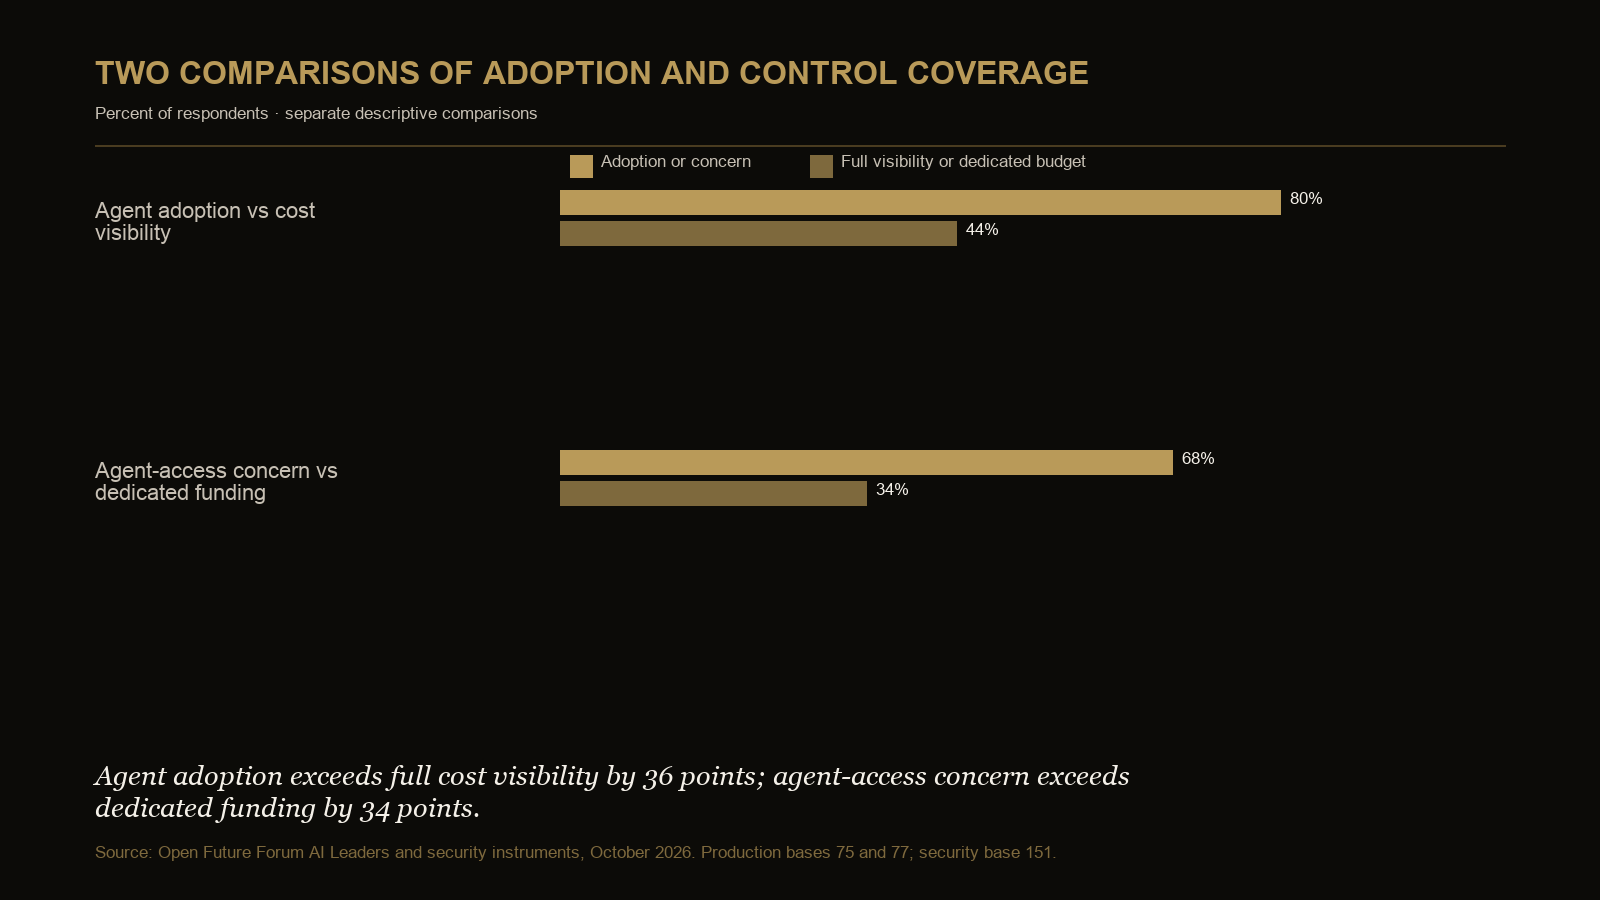
| Comparison | First measure | Second measure | Difference |
|---|---|---|---|
| Production agents and cost visibility | 80% report at least one production agent (base 75) | 44% report full real-time cost visibility (base 77) | 36 points |
| Agent-access concern and dedicated security funding | 68% name agent access as a problem (base 151) | 34% report a dedicated security line (base 151) | 34 points |
The first row compares two questions from the same event but is not a matched-respondent measure. The second compares answers within the security instrument. Neither difference is a causal or longitudinal measure.
Tested against the record
McKinsey's 2026 State of AI reports broader enterprise scaling and identifies a small high-performer group. Open Future Forum uses a different measure: AI counts as embedded only when removing it would change costs or hiring. Under that definition, 13 percent of respondents are embedded.
What this means for the executive team
Treat “in production” as a deployment milestone, not proof of transformation. Executives should identify which budget, headcount, workflow, control or customer measure changed because the system exists. If none did, the organization does not meet this report's definition of embedded AI.
Questions this report answers
How much AI is embedded?
Thirteen percent by the report's strict operating-model definition (base 91).
How do the deployed and embedded shares compare?
The deployed share exceeds the embedded share by 33 percentage points (base 91). This is a cross-sectional difference.
Which constraints appear in the related instruments?
Data, integration, incomplete cost visibility and limited dedicated funding for access control.
Key citable facts
- Open Future Forum's October 2026 maturity instrument finds 46 percent deployed and 13 percent embedded (base 91).
- The deployed share exceeds the embedded share by 33 points (base 91).
- Eighty percent run production agents (base 75), while 44 percent have full real-time cost visibility (base 77).
Methodology and honesty notes
The direct maturity instrument is new and has no prior-period like-for-like comparison. The 13 percent figure is a baseline, not a trend. Cross-instrument relationships are descriptive and do not prove that the same respondents produced every line. Respondents are deduplicated per question by email; invited-only rows are excluded.
The 36-point production comparison uses two questions from the same event, with bases of 75 and 77. It does not track the same respondents one by one. The 34-point security comparison uses the share naming agent access as a problem and the share reporting a dedicated security line (base 151); it does not establish whether actual security spending is adequate.
Related reading
Citation and editions
Suggested citation: Newlands, M. (2026). AI Transformation Report, Edition 3. Open Future Forum, October 2026. This edition supersedes Edition 2, September 2026.
Work These Questions with Executive Peers
Forum Select meets through small, off-the-record gatherings. Membership is by application and referral.