One-sentence answer
Enterprise AI accountability works only when the executive team connects four records that are often managed separately: who authorizes the purchase, where the money sits, what result proves value and who controls the system in production.
Executive finding
CEOs dominate sign-off, with finance second. The controls that should follow approval are less consistently visible. Security respondents name agent access as a problem twice as often as they report a dedicated AI security line, but that comparison describes funding structure rather than budget adequacy: security work may also be funded case by case or from an existing budget. Separately, fewer than half of AI Leaders respondents can see AI operating costs in real time.
September described a mismatch between concentrated buying authority and diffuse accountability. October adds separate indicators on cost allocation, credentials and production-data access that help executives test that mismatch.
What October adds
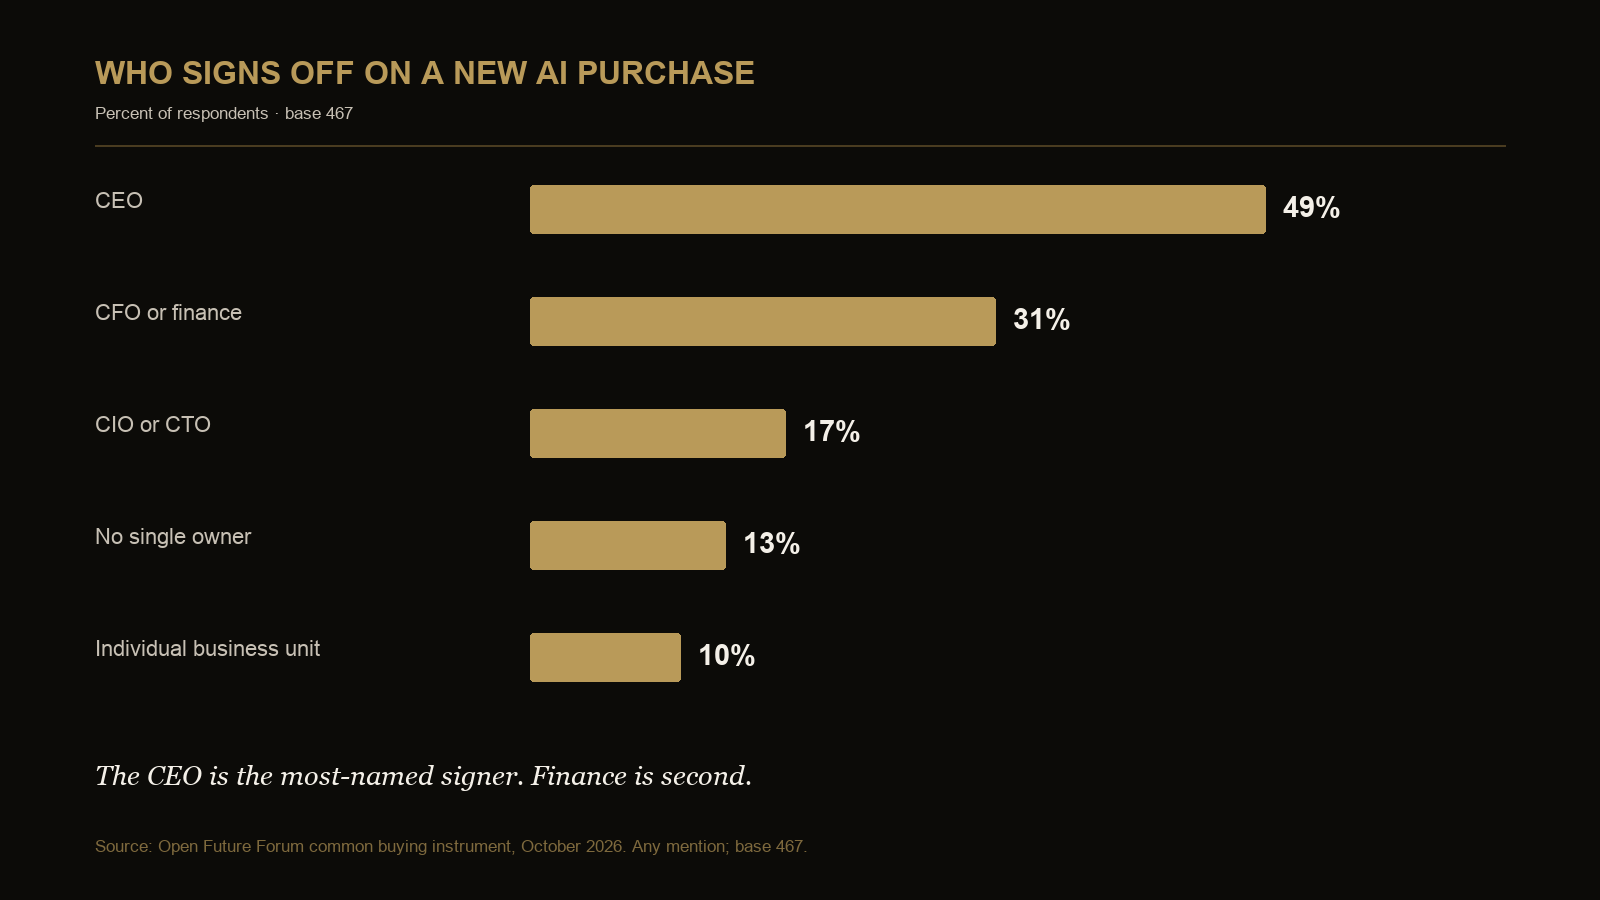
The common buying instrument covers 467 unique respondents on sign-off and 389 on budgets, blockers and payback. The CEO is named by 49 percent, finance by 31 percent, the CIO or CTO by 17 percent, an individual business unit by 10 percent and no single owner by 13 percent.
The security base is 151: 68 percent name agent access as a problem, while 34 percent report a dedicated budget line. The two measures should not be read as a funding shortfall because the instrument also captures case-by-case and existing-budget routes. In marketing, 81 percent are past exploration and the impact base is 218. Founder and investor benchmarks carry forward because the available exports contain no new version of those instruments. The new October evidence comes from the AI Leaders production questions.
What changed, and what did not
October changes the report in two important ways. First, the common sign-off question now includes the AI Leaders event, bringing its base to 467. Second, the AI Leaders instrument adds operational questions about maturity, production-agent fleets, cost visibility, bottlenecks and access methods. Those additions make it possible to place the buying decision beside the controls that follow it. They do not create a longitudinal panel: the respondents are not the same people tracked from month to month, and the expanded base means the current authority result should be read as a new cross-section.
Several boundaries did not change. Founder pricing and investor portfolio results are retained as current benchmarks because no newer version of those instruments was fielded. Marketing status and impact remain separate questions with different bases. Security priorities and security funding come from one mixed event cohort, while the production access method comes from AI Leaders. None of those populations is silently merged. October is therefore a broader operating picture, not a claim that one executive population moved by a stated number of points.
The principal advance is diagnostic. Earlier editions could identify who appeared in the purchase decision and where money came from. This edition can ask whether the same organization also knows the cost, access path and operating owner of the resulting production system. That is why the October report treats authorization, funding, proof and control as four connected records rather than four isolated survey results.
Where this research comes from
Edition 4 combines first-party questions embedded in event-registration flows across finance, security, marketing, founder, investor and AI Leaders events. The 49 available exports contain 6,688 non-invited registrations and 4,633 unique non-invited email addresses. Each question is deduplicated separately by email, with the latest response retained.
How to read cross-instrument evidence
Every percentage belongs to its stated question base. The 467 sign-off answers, 389 finance answers, 151 security answers, 230 marketing-status answers and 75-to-101 AI Leaders answers are not one master survey. They were collected through different event flows and can contain overlapping people, but the package does not treat them as a matched panel. Comparisons across instruments are used to identify an executive handoff worth examining, not to calculate a combined rate.
Multi-select questions use “any mention.” A respondent can name more than one signer, funding source, blocker or impact, so those shares can exceed 100 percent. Single-choice status questions describe a distribution. Matched tables are labeled separately; for example, the maturity-by-cost table includes the 75 people who answered both questions. A simple difference between two full-base percentages is not silently presented as matched evidence.
The analysis is descriptive. The events are selective communities and registration flows, not a probability sample of all enterprises. Application status is not attendance, and invited-only records are excluded. A statistic can therefore be a useful benchmark and still require local verification. The operating record in this report is the bridge: executives can test whether the same authority, funding, proof or control issue exists in their own workflows using internal evidence.
Who owns the AI buying decision
Across the common sign-off question, the CEO appears in 49 percent of answers, finance in 31, the CIO or CTO in 17, a business unit in 10 and no single owner in 13 (base 467, any mention). The AI Leaders cohort is even more CEO-led: 56 percent name the CEO and 28 percent the CIO or CTO (base 86).
Answers vary sharply by the respondent's role. Technology leaders may run the system without signing the purchase, so operational responsibility and purchasing authority should be measured separately.
Where the money comes from and what blocks it
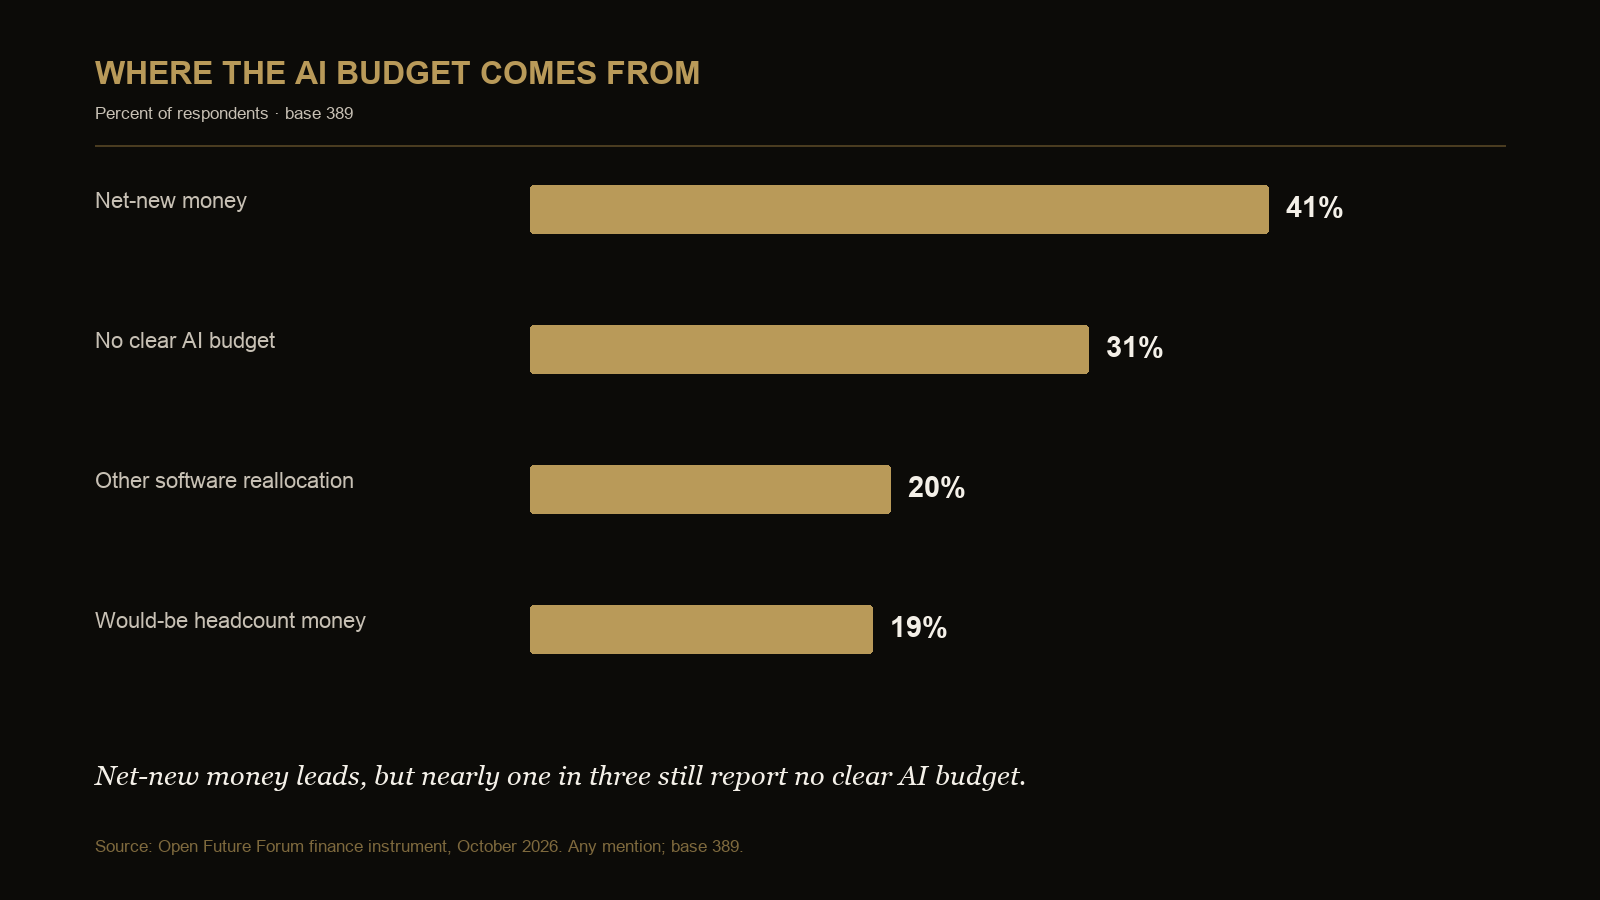
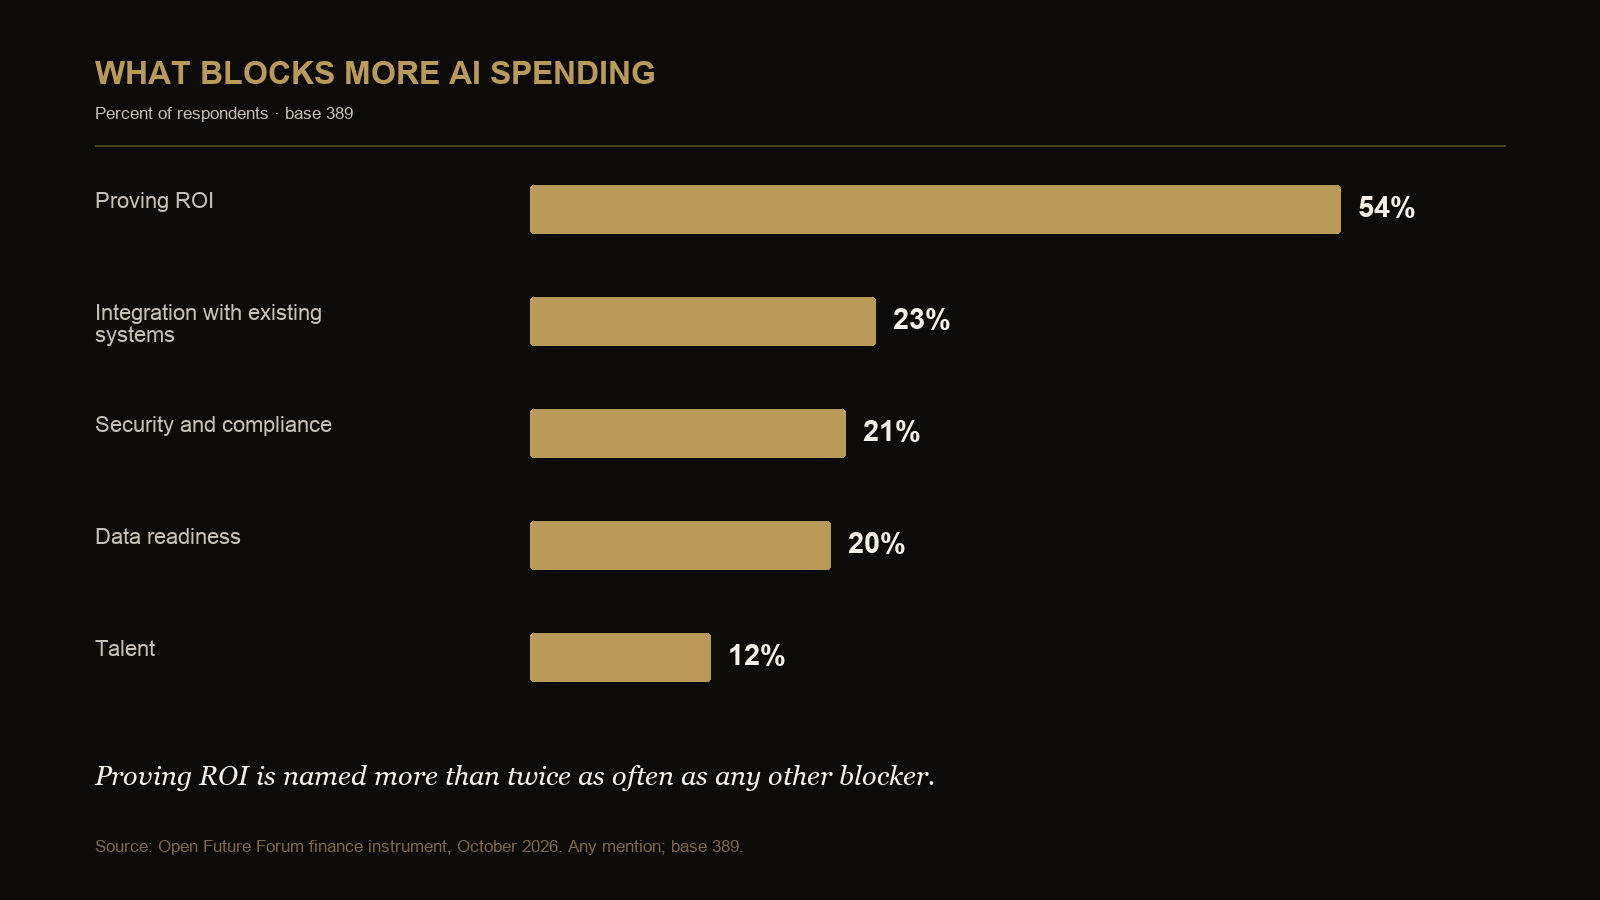
Net-new money leads at 41 percent, followed by no clear budget at 31, software reallocation at 20 and headcount substitution at 19 (base 389, any mention). Proving ROI is the blocker for 54 percent, integration for 23, security and compliance for 21, data readiness for 20 and talent for 12.
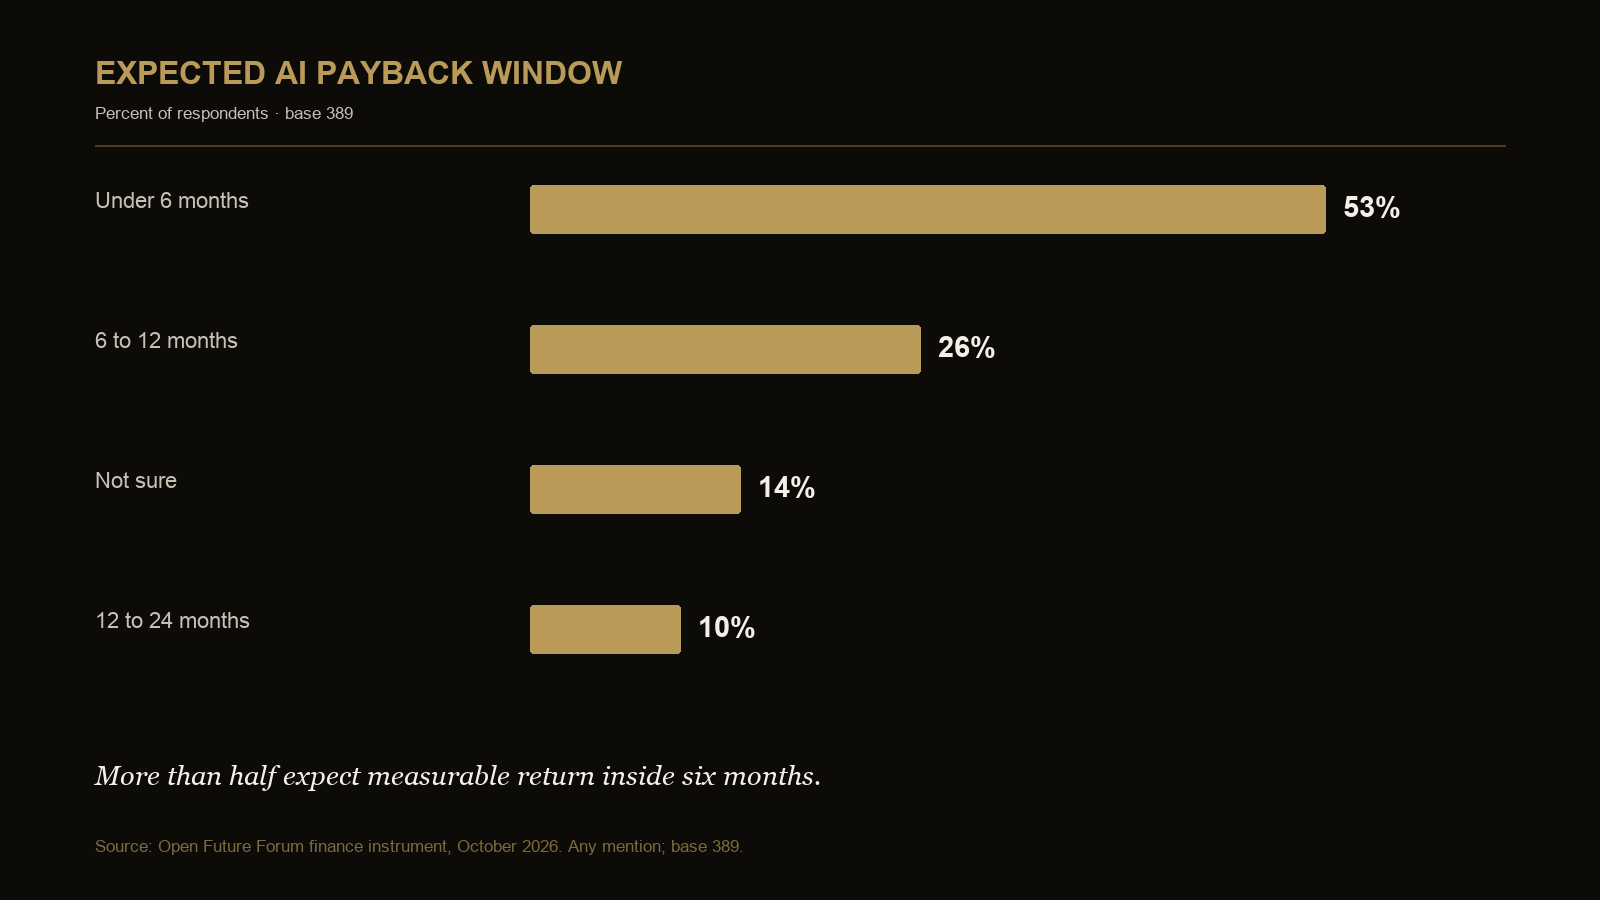
Fifty-three percent expect measurable return inside six months, 26 percent in six to twelve months, 10 percent in twelve to twenty-four months and 14 percent are not sure (base 389, any mention). That is a short proof window for organizations whose budget ownership is not always settled.
Production controls
Fifty-nine percent of AI Leaders respondents are deployed or embedded (base 91). Eighty percent run at least one production agent and 29 percent run more than twenty (base 75). Only 44 percent have full real-time cost visibility (base 77). Data access and quality leads production bottlenecks at 39 percent (base 75, any mention); 37 percent of applicable respondents use shared service accounts for access (base 49).
Production-agent adoption exceeds full real-time cost visibility by 36 percentage points. This figure compares two questions from the same event, answered by 75 and 77 respondents respectively; it is not a matched-respondent measure.
Role by role
CEO: the most-named signer and the role most likely to describe ownership as centralized.
CFO: the second-most-named buying authority, responsible for testing the short payback expectations against actual costs and benefits.
CISO: agent access is the leading problem; dedicated budget is one of several reported funding routes, so its lower share does not by itself establish underfunding.
CMO: generally past exploration, with reported value divided among workforce capacity, content speed and customer knowledge.
AI leader: operating production agents with incomplete cost visibility and uneven identity controls.
Founder and investor: the September benchmarks carry forward because no new version of either instrument was available.
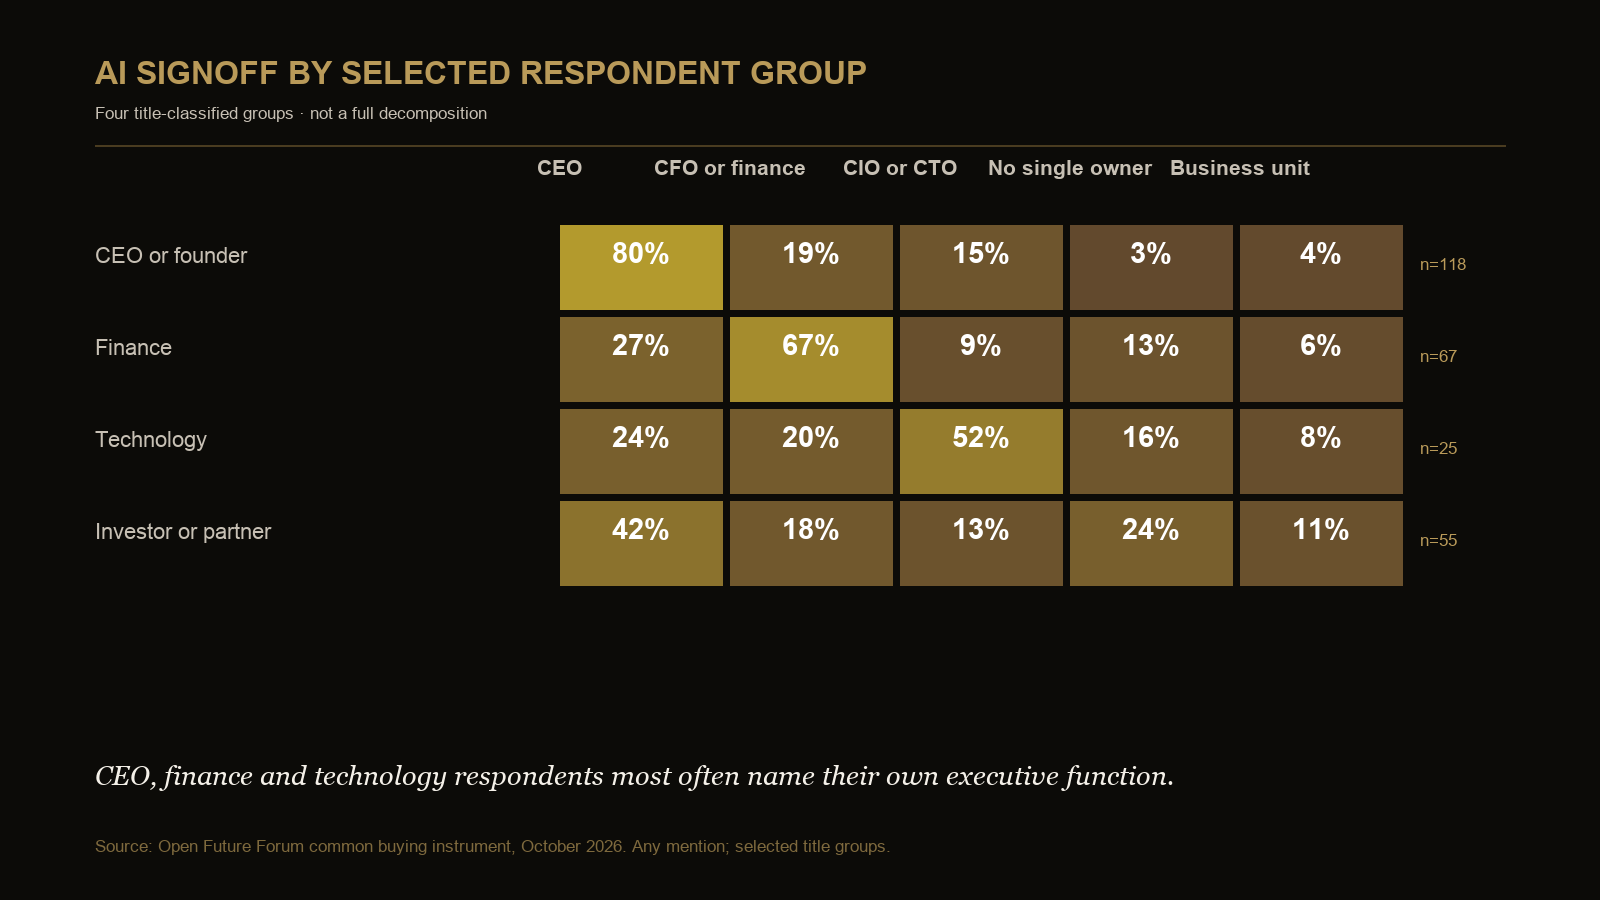
The current seat cuts add more detail to those role summaries. CEO and founder respondents name the CEO in 80 percent of common sign-off answers, while finance respondents name finance in 67 percent and technology respondents name the CIO or CTO in 52 percent. The pattern is not evidence that one group is correct and the others are mistaken. It shows that authority looks different depending on where a respondent sits. A useful governance conversation begins by asking which decision each seat means: selecting a vendor, approving money, accepting risk, launching a workflow, or stopping it.
The finance cuts also expose different assumptions about economic proof. CEO and founder respondents name headcount-linked funding in 30 percent of answers, versus 19 percent for finance respondents. They expect payback inside six months in 67 percent of answers, versus 45 percent for finance respondents. Finance respondents place more weight on six-to-twelve-month payback, 36 percent versus 26 percent. These are descriptive role cuts, not evidence that one group has better forecasts. They tell an executive team where to reconcile the definition of benefit before approving scale.
Security and operating roles face another handoff. The security cohort puts agent access first, and the separate AI Leaders cohort shows both per-agent credentials and shared service accounts in use. A CISO can set an access standard, but the technology owner must implement it, the business owner must preserve the workflow boundary and the finance owner must recognize the cost of monitoring, review and remediation. The record fails if any one of those responsibilities is assumed rather than named.
October evidence book
The exhibits connect four parts of the operating model: who approves AI, how it is funded, how quickly it must show a return and whether production controls keep pace with deployment.
Authority
Common buying instrument
| Answer | Count | Share |
|---|---|---|
| CEO | 227 | 49% |
| CFO or finance | 144 | 31% |
| CIO or CTO | 79 | 17% |
| No single owner | 60 | 13% |
| Individual business unit | 45 | 10% |
Base 467; any mention, so shares can sum above 100 percent.
The common instrument names the CEO in 227 of 467 answers. Finance appears in 144 and technology in 79. Sixty respondents report no single owner. The multi-select design matters: authority can be shared, so these categories describe who appears in the decision rather than an exclusive org chart.
| Respondent seat | Base | CEO | Finance | CIO or CTO | No owner | Business unit |
|---|---|---|---|---|---|---|
| CEO or founder | 118 | 80% | 19% | 15% | 3% | 4% |
| Finance | 67 | 27% | 67% | 9% | 13% | 6% |
| Technology | 25 | 24% | 20% | 52% | 16% | 8% |
| Investor or partner | 55 | 42% | 18% | 13% | 24% | 11% |
Selected title-classified groups shown: 265 of 467 respondents. The other/unclassified group (195) and smaller groups (7) are omitted. Any mention; bases from 10 to 39 are directional.
The seat cut shows strong role-based attribution. CEO and founder respondents name the CEO in 80 percent of answers; finance respondents name finance in 67 percent; and technology respondents name the CIO or CTO in 52 percent. An ownership map should therefore record the respondent's seat alongside the aggregate result.
Funding and proof by respondent seat
| Respondent seat | Base | Net-new | No clear budget | Software reallocation | Headcount-linked |
|---|---|---|---|---|---|
| CEO or founder | 89 | 39% | 24% | 16% | 30% |
| Finance | 67 | 43% | 25% | 22% | 19% |
| Technology | 13 | 46% | 38% | 8% | 8% |
| Investor or partner | 49 | 43% | 43% | 10% | 12% |
| Other or unclassified | 165 | 39% | 33% | 25% | 16% |
Rows shown cover 383 of 389 respondents; omitted title categories total 6. Classification uses title keywords; the technology row is directional; multi-answer combinations use any mention.
| Respondent seat | Base | ROI | Integration | Security | Data | Talent |
|---|---|---|---|---|---|---|
| CEO or founder | 89 | 55% | 30% | 15% | 16% | 13% |
| Finance | 67 | 48% | 13% | 21% | 28% | 10% |
| Technology | 13 | 54% | 8% | 15% | 23% | 15% |
| Investor or partner | 49 | 51% | 18% | 29% | 14% | 4% |
| Other or unclassified | 165 | 56% | 25% | 21% | 21% | 13% |
Rows shown cover 383 of 389 respondents; omitted title categories total 6. Classification uses title keywords; the technology row is directional; multi-answer combinations use any mention.
| Respondent seat | Base | Under 6m | 6–12m | 12–24m | Not sure |
|---|---|---|---|---|---|
| CEO or founder | 89 | 67% | 26% | 3% | 4% |
| Finance | 67 | 45% | 36% | 12% | 10% |
| Technology | 13 | 54% | 15% | 8% | 31% |
| Investor or partner | 49 | 37% | 29% | 12% | 22% |
| Other or unclassified | 165 | 55% | 21% | 12% | 16% |
Rows shown cover 383 of 389 respondents; omitted title categories total 6. Classification uses title keywords; the technology row is directional; multi-answer combinations use any mention.
CEO and founder respondents report headcount-linked funding more often than finance respondents, while every major seat puts ROI first among blockers. Payback expectations also differ by role. These are title-classified cuts from the same instrument, not separate role-specific surveys, and the technology bases are directional.
Funding, proof and payback
AI budget source
| Answer | Count | Share |
|---|---|---|
| Net-new money | 159 | 41% |
| No clear AI budget | 120 | 31% |
| Other software reallocation | 77 | 20% |
| Would-be headcount money | 73 | 19% |
Base 389; any mention, so shares can sum above 100 percent.
Barrier to additional AI spending
| Answer | Count | Share |
|---|---|---|
| Proving ROI | 211 | 54% |
| Integration with existing systems | 89 | 23% |
| Security and compliance | 80 | 21% |
| Data readiness | 79 | 20% |
| Talent | 45 | 12% |
Base 389; any mention, so shares can sum above 100 percent.
Expected time to measurable return
| Answer | Count | Share |
|---|---|---|
| Under 6 months | 208 | 53% |
| 6 to 12 months | 101 | 26% |
| 12 to 24 months | 37 | 10% |
| Not sure | 53 | 14% |
Base 389; any mention, so shares can sum above 100 percent.
Forty-one percent use net-new money, while 31 percent report no clear AI budget. Fifty-four percent name proving ROI as a blocker, and 53 percent expect measurable return inside six months. Approval is only the first step; teams must produce evidence quickly enough to support a budget that may not yet have a stable owner.
The full funding, blocker and payback charts are consolidated in Executive AI Statistics. This report keeps the cross-functional interpretation: authority, funding and proof must resolve to the same operating record.
Production control
In the Microsoft event, 80 percent report at least one production agent (base 75) and 44 percent report full real-time cost visibility (base 77). The 36-point difference is a comparison of separate question bases, not a matched-respondent statistic. In the security instrument, 68 percent name agent access as a problem and 34 percent report a dedicated AI security line (base 151), a difference of 34 points. That second difference compares a problem measure with one funding route; it is not an estimate of budget sufficiency because respondents can also fund security case by case or through an existing budget.
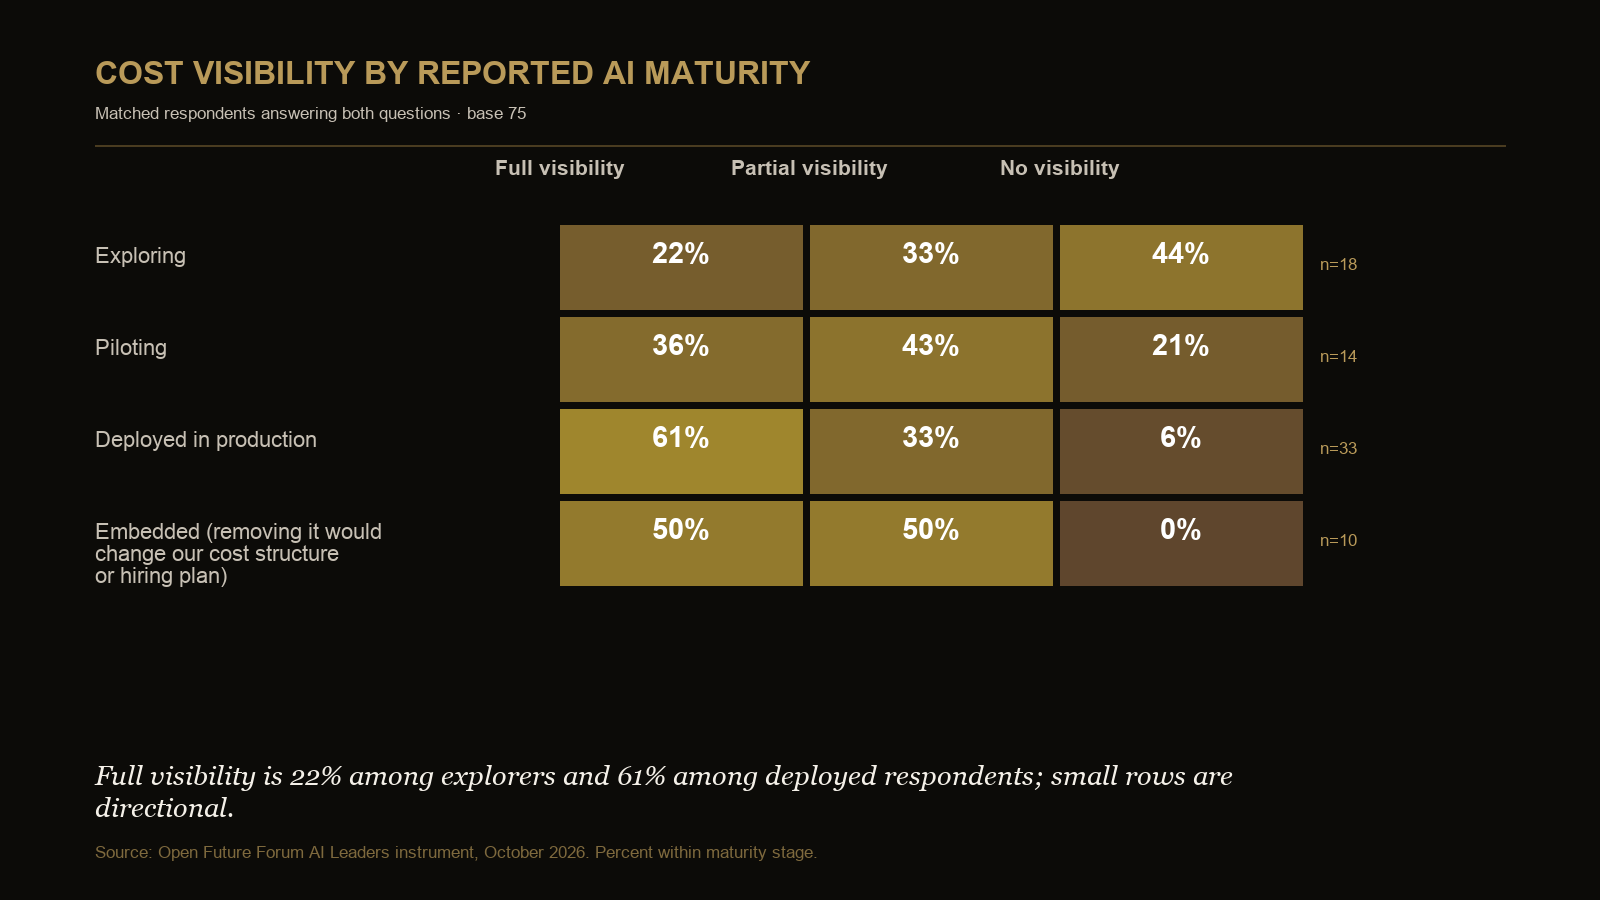
Among the 75 people who answered both the maturity and cost-visibility questions, full visibility is 22 percent among explorers and 61 percent among respondents deployed in production. The embedded row is 50 percent on a base of ten and is directional.
| Group | Base | Full visibility | Partial visibility | No visibility |
|---|---|---|---|---|
| Exploring | 18 | 22% | 33% | 44% |
| Piloting | 14 | 36% | 43% | 21% |
| Deployed in production | 33 | 61% | 33% | 6% |
| Embedded (removing it would change our cost structure or hiring plan) | 10 | 50% | 50% | 0% |
Matched respondents answering both questions; base 75. Small row bases are directional.
Sample composition
| Measure | October total |
|---|---|
| Event exports | 49 |
| All rows | 28,195 |
| Invited-only rows excluded | 21,507 |
| Non-invited registrations | 6,688 |
| Unique non-invited email addresses | 4,633 |
Core instrument responses were collected through September 30, 2026. The network totals include one October 1 pending registration with no core-instrument answer. Counts match the locked October package.
| Event | Non-invited registrations | Unique non-invited emails | Approved | Declined |
|---|---|---|---|---|
| ThinkingAI Agentic Growth Summit 2026 | 1,497 | 1,468 | 947 | 514 |
| VC - Start Up Circle Block Party | 357 | 357 | 177 | 27 |
| SNOWFLAKE SUMMIT 26 Side Event | 323 | 323 | 195 | 127 |
| Enterprise AI at Microsoft | 314 | 314 | 157 | 157 |
| Investors Summer Drinks | 300 | 300 | 117 | 181 |
| CEO PRIVATE DINNER | 256 | 214 | 51 | 193 |
| Agentic AI Meets Go-to-Market: Panel and Mixer for Marketing and Growth Leaders | 252 | 252 | 120 | 129 |
| AI Agents for Fintech Engineering Teams | 242 | 242 | 166 | 26 |
| CISO Roundtable Dinner | 234 | 195 | 55 | 170 |
| Enterprise AI & Agentic Security Dinner | 217 | 217 | 61 | 151 |
Event-level counts use the 49 current exports after one superseded ThinkingAI snapshot was excluded. Repeated display titles can represent distinct event instances. “Non-invited” includes approved, declined, pending and waitlisted applications; it does not mean attendee.
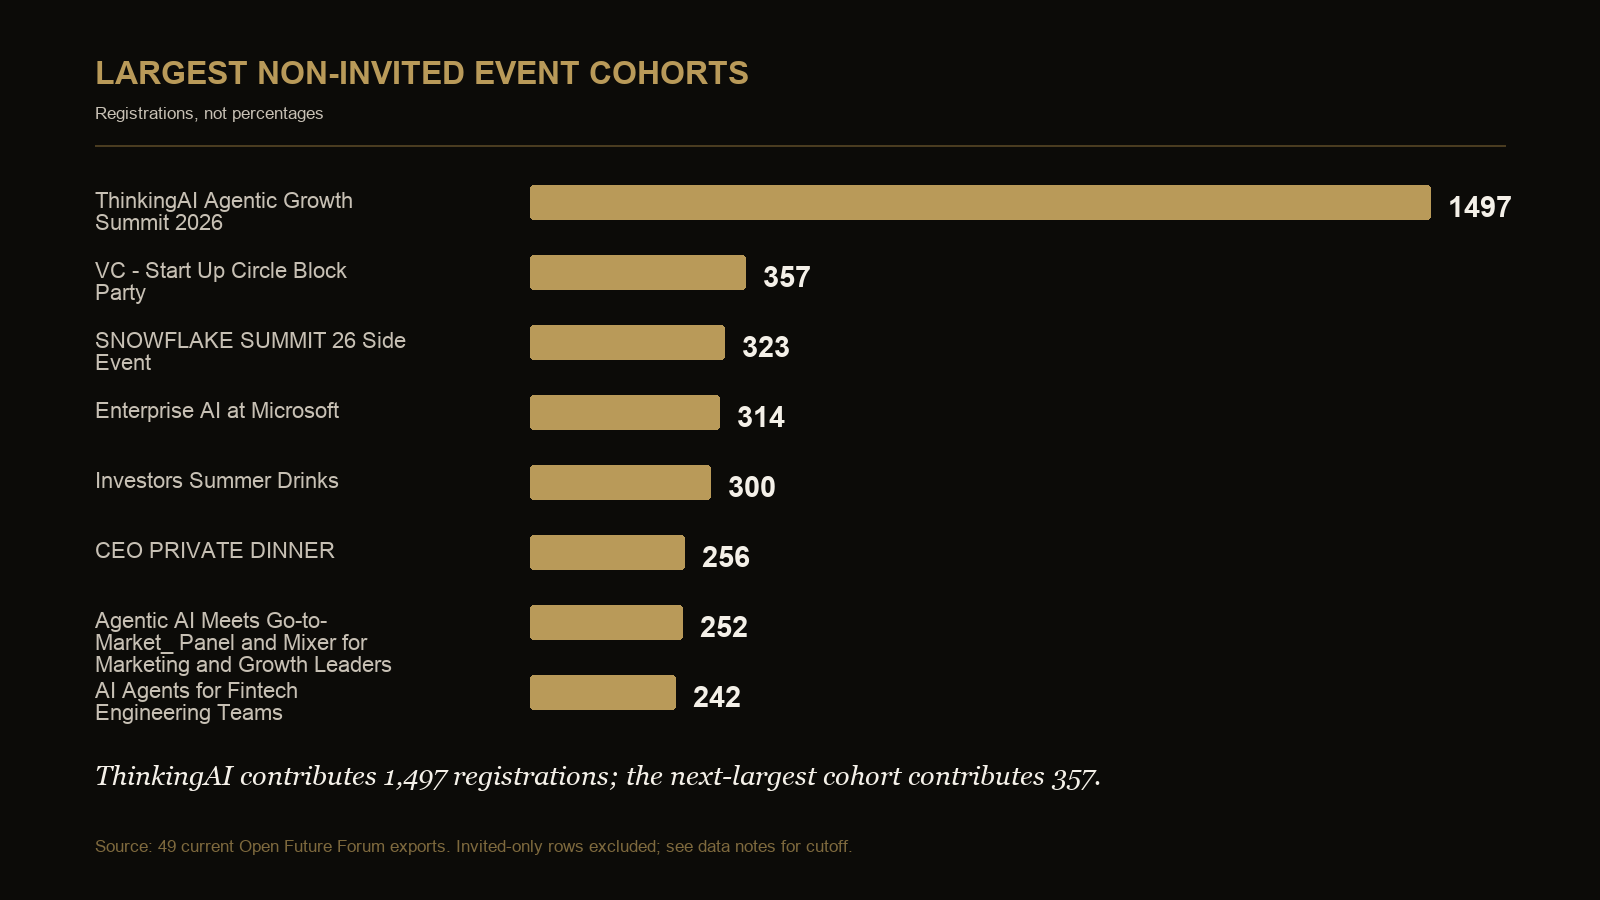
The source events range from large open gatherings to small role-specific rooms. Because those populations differ, every result retains its event, instrument and question base; the 6,688 registrations are not treated as one interchangeable sample.
The complete sample-composition chart is available in Executive AI Statistics. The table remains here so readers can assess the source mix without mistaking registration totals for a single survey base.
What the open-text material can and cannot add
Four documented open-text sets were reviewed as context: 74 nonblank responses from Marketing Measurement and Attribution in the AI Era, 29 from Partner Marketing and the New AI Ecosystem, 123 from Agentic AI Meets Go-to-Market and 43 from AI Leaders. The marketing sets raise attribution, ecosystem, agentic go-to-market and peer-learning questions. The AI Leaders set raises adoption, agents, infrastructure, deployment and governance topics.
Those readings help explain which operating questions executives bring into the rooms; they do not estimate how prevalent a theme is. The responses were not coded with a formal codebook, independently double-coded or tested for inter-rater agreement. For that reason, this report publishes neither theme counts nor percentages and does not combine the four sets into an “executive sentiment” score. Their proper use is to shape the questions in an operating review, not to manufacture another quantitative finding.
External context
The October evidence aligns with McKinsey's 2026 State of AI, which reports wider agent scaling alongside cost and financial-impact constraints, and with IBM's 2026 Cost of a Data Breach Report, which emphasizes control of agentic identities. Open Future Forum adds a first-party operator view: data access ranks ahead of compute, and production-agent adoption exceeds full real-time cost visibility by 36 percentage points.
The external studies provide context only. Their publishers are not affiliated with or endorsing this report.
| Evidence source | What it contributes | What Open Future Forum adds | Comparison limit |
|---|---|---|---|
| McKinsey, State of AI 2026 | A broad view of agent scaling, cost pressure and financial impact | First-party event-instrument evidence connecting executive authority, budget routes and workflow-level production controls | Different sampling, wording and populations; percentages should not be pooled |
| IBM, Cost of a Data Breach 2026 | External context on securing agentic identities and access | A reported access-method distribution and a security-priority ranking from two clearly separated cohorts | The IBM study and this report answer different questions and do not form a trend series |
The comparison is strongest at the level of operating questions: cost, identity and evidence remain important once agents reach production. It is weakest when used to compare percentages. This report does not reweight its respondents to match either external study and does not use an external headline to validate a first-party percentage.
What this means for the executive team
Record the owner, metric, credential and cost center together. Knowing who approved AI is not enough to establish who controls it in production. Every production agent should have a named business owner, an accountable technical owner, an auditable identity, a measurable workflow and a visible cost.
A practical operating cadence
At approval, the executive sponsor should define the business boundary, source of money, expected result and decision date. Before production, the technical, data, security and legal owners should confirm access, logging, human review and rollback. During operation, finance should reconcile actual cost to the workflow while the business owner reviews the result against the fixed baseline. At the next gate, the named decision maker should expand, remediate, pause or stop the workflow using the same record.
This cadence keeps a pilot from becoming permanent by inertia. It also prevents a common category error: treating vendor approval, business approval and production approval as the same decision. A vendor may be approved for limited use while a particular workflow remains unapproved; a workflow may be approved while an expansion to new data or actions still requires a new review.
Failure modes the record should expose
- Signer without operator: an executive approves the purchase, but no one owns reliability, change control or rollback for the workflow.
- Budget without unit economics: a central envelope exists, but model, data, integration, review and control costs cannot be allocated to the outcome being claimed.
- Outcome without baseline: the team reports faster work or more output without a dated, comparable starting point and a named source system.
- Access without identity: an agent can reach data or tools through a shared account, but its actions cannot be reliably attributed or independently revoked.
- Pilot without a gate: the workflow remains live because no date, threshold or decision owner was established for expansion or retirement.
- Control without evidence: a policy says review, logging or revocation exists, but the organization cannot show a test, log, approval or exception record.
The October data does not count how often each failure mode occurs. They are operating tests derived from the observed separation among sign-off, budget, cost visibility and identity evidence.
Management hypotheses and falsifiers
This report supports questions to test, not unmeasured claims to repeat as findings. If an executive team believes centralized sign-off creates accountability, the falsifier is a production workflow whose launch, pause or stop owner cannot be named. If it believes a central AI budget creates cost control, the falsifier is an active workflow whose full monthly run cost cannot be reconstructed. If it believes access is governed, the falsifier is an agent action that cannot be attributed to a bounded identity or promptly revoked. If it believes value is proven, the falsifier is a claimed benefit without a prior baseline, defined measurement window and source-system evidence.
These tests can be run internally without pretending that the research measured the result. Over time, an organization can track the percentage of production workflows passing each test. That internal measure should be clearly separated from the Open Future Forum survey statistics.
Executive AI operating record
Use one record per production workflow. The purpose is not to create another strategy document; it is to make authority, money, proof and control inspectable in one place.
| Record field | Executive question it resolves | Minimum evidence | Review trigger |
|---|---|---|---|
| Business decision owner | Who can approve, expand, pause or stop the workflow? | Named executive and documented decision rights | Change of sponsor, scope or risk tier |
| Technical operating owner | Who is accountable for reliability and change control? | Named operator, service record and escalation path | Model, vendor or architecture change |
| Funding source and cost center | Where did the money come from and where do run costs land? | Approved budget route, cost-center code and monthly allocation | Budget transfer or material variance |
| Outcome and baseline | What result must improve, compared with what starting point? | Baseline, target, measurement window and source system | Target miss or measurement-method change |
| Production cost | What does the workflow cost at its actual level of use? | Model, infrastructure, data, integration and control costs | Volume, pricing or model change |
| Data and access | Which systems can the workflow read from or act in? | Data inventory, permission scope and approval record | New data source or permission expansion |
| Agent identity | Which auditable identity performs each action? | Credential type, owner, log location and revocation path | Credential or ownership change |
| Control status | Which security, legal and operational checks remain open? | Approvals, exceptions, expiry dates and remediation owner | Exception expiry or material incident |
| Evidence date | How current is the record? | Last-reviewed date and named reviewer | At least quarterly, and after a material change |
The four executive lanes should reconcile: the person who can authorize an expansion should be able to see its funding source, latest benefit evidence, current run cost and unresolved control exceptions in this same record.
Who else should use this evidence
Boards can use the four-record model to test whether management reporting connects authority, economics, outcomes and control rather than presenting adoption counts alone. Finance teams can use the seat differences to challenge benefit definitions and short payback expectations. Security and legal teams can use the operating record to connect access, exceptions and contractual obligations to a named workflow owner. Technology and data leaders can show where shared platforms end and workflow accountability begins. People leaders can distinguish realized cash savings from avoided hiring and redeployed capacity. Investors and transaction teams can ask for the same records during diligence without treating this selective event sample as a market forecast.
The appropriate question for each audience is not “does this percentage describe my company?” It is “which record would prove whether the same risk or handoff exists here?”
Definitions used in this report
Sign-off means a role appears in a respondent's answer to the purchase-approval question. It does not automatically mean exclusive ownership, and any-mention shares can sum above 100 percent.
Production agent means a respondent reported at least one agent operating in production in the AI Leaders instrument. The question measures fleet presence, not risk, autonomy or business value.
Full real-time cost visibility is the respondent's selected answer to the cost-visibility question. The instrument does not independently audit the cost system or prescribe which cost categories are included.
Dedicated AI security line is one reported funding route. It is not the whole of security spending, because case-by-case funding and existing-security-budget funding are also captured.
No clear AI budget is the normalized any-mention category for “not sure / no AI budget yet.” It does not prove that no money was spent.
Respondent seat is a deterministic title classification using disclosed keyword rules. It is an analytical cut, not a role selected by the respondent, and smaller rows are directional.
Non-invited registration is a source-system category including approved, declined, pending and waitlisted applications. It is not an attendance measure.
Questions this report answers
Where does enterprise AI accountability break after sign-off?
It breaks when buying authority is recorded but funding ownership, proof of value, production identity and run-cost control are not connected. The CEO is most named at 49 percent and finance at 31 percent (base 467, any mention), yet 31 percent report no clear AI budget (base 389, any mention).
Which four records should the executive team connect?
The authorization record, budget and cost record, outcome-evidence record, and production-control record should resolve to the same workflow and named owners.
Which October findings show that approval and operating control can diverge?
Proving ROI is the leading spending blocker at 54 percent (base 389), while production-agent adoption exceeds full real-time cost visibility by 36 percentage points (bases 75 and 77; separate questions from the same event). In a separate security instrument, 68 percent name agent access as a problem and 34 percent report a dedicated AI security line (base 151). The security comparison describes funding structure, not budget adequacy.
How should an executive team use this report?
Use the cross-functional evidence to audit handoffs between the signer, budget owner, workflow owner and control owner; use the linked role reports for the detailed finance, security, marketing and production measures.
Does a CEO signature mean the CEO operates the AI system?
No. Sign-off describes purchase authority as reported by respondents. Technical release, data access, cost review and incident response can belong to other named owners. The operating record should preserve that delegation without turning it into an ownership vacuum.
Is the 34-point security comparison evidence of underfunding?
No. It compares 68 percent naming agent access as a problem with 34 percent reporting one funding route, a dedicated AI security line (base 151). Respondents also report case-by-case and existing-budget routes, so the difference does not measure total funding or adequacy.
What would count as stronger evidence in a future edition?
A matched longitudinal panel, a consistent item set across roles and verified workflow records would support stronger change and operating-effect claims. This edition instead preserves question-level bases, separates cohorts and labels role cuts so the current evidence is useful without overstating what it proves.
Key citable facts
- Open Future Forum's October 2026 data finds the CEO in 49 percent of AI sign-off answers and finance in 31 percent (base 467, any mention).
- Net-new money funds AI in 41 percent of finance-instrument answers, while 31 percent report no clear AI budget (base 389).
- Production-agent adoption exceeds full real-time cost visibility by 36 points: 80 percent report production agents and 44 percent report full real-time cost visibility (bases 75 and 77).
Methodology and honesty notes
Respondents are deduplicated by email for each question, with the latest response retained. Invited-only rows are excluded. Multi-select questions use any mention. Bases vary by question and are always stated. No headline is published below 40 responses; bases from 10 to 39 are directional. The sample is selective, not probabilistic. Cohorts are different people, not a panel. Founder and investor core lines are carried forward where no new instrument exists and are labeled as such.
Related reading
- AI Leaders AI Leverage Report
- AI Transformation Report
- Executive AI Statistics
- Who Signs Off on AI Purchases in 2026?
- How Many AI Agents Are in Production in 2026?
Citation and editions
Suggested citation: Newlands, M. (2026). Executive AI Leverage Report, Edition 4. Open Future Forum, October 2026. This edition supersedes Edition 3, September 2026.
Work These Questions with Executive Peers
Forum Select meets through small, off-the-record gatherings. Membership is by application and referral.