In this report
- The October answer
- What changed since the Preview
- Where this research comes from
- The production ladder
- The agent fleet
- Agent adoption and cost visibility
- Where production gets stuck
- How agents reach enterprise data
- Who signs and what they plan to spend
- What AI leaders want next
- Tested against the record
- What this means for the AI leader
- What this means for the CEO, CFO and CISO
- Questions this report answers
- Key citable facts
- Methodology and honesty notes
- Citation and editions
The October answer
Across separate measures, production adoption is more prevalent than full cost visibility. Most respondents report AI deployed or embedded, and four in five report at least one production agent. Fewer than half have full real-time operating-cost visibility, 37 percent of applicable responses use shared service accounts, and data access and quality is the leading production constraint.
The Preview relied on small technology-seat cuts. Edition 1 adds a dedicated operator instrument that measures agent fleets alongside visibility into cost, credentials and data dependencies.
What changed since the Preview
The September Preview used technology-seat cuts drawn from other instruments, with bases of 21 to 32, so every finding was directional. Edition 1 uses a dedicated AI Leaders instrument, and every primary question clears the program's 40-response publication floor.
The new instrument measures three issues raised in the Preview: production-agent count, production bottlenecks and agent credentials. The results show sizeable fleets, data access as the leading bottleneck and shared service accounts in 37 percent of applicable responses.
Where this research comes from
The primary data comes from the Enterprise AI at Microsoft application flow. The full export contains 919 rows, most of them invited contacts. After invited-only rows are excluded and respondents are deduplicated by email for each question, the instrument bases range from 71 to 101. Questions cover respondent seat, maturity, buying authority, planned spend, cost visibility, production-agent count, production bottlenecks and enterprise-data access.
The production ladder
Forty-six percent say AI is deployed in production and 13 percent say it is embedded, meaning removing it would change the cost structure or hiring plan. Twenty percent are piloting and 21 percent are exploring (base 91).
Deployment means a system is live. The embedded category applies only when removing AI would change the organization's cost structure or hiring plan. Thirteen percent meet that stricter test; another 46 percent are in production without reporting that level of operational dependence.
The agent fleet
Thirty-six percent run one to five agents, 15 percent run six to twenty, and 29 percent run more than twenty. Twelve percent run none and 8 percent are not sure (base 75).
The modal answer is one to five agents, while nearly one respondent in three reports more than twenty. Controls designed around a single assistant may not be adequate for organizations running fleets at that scale.
Agent adoption and cost visibility
Eighty percent report at least one production agent (base 75), while 44 percent report full real-time cost visibility (base 77), a 36-percentage-point difference. The questions came from the same event but do not form a matched-respondent measure.
Thirty-nine percent report partial cost visibility, and 17 percent report no real-time visibility. The matched fleet analysis below provides more detail, but the overall figures establish that agent adoption is more common than full cost visibility.
Where production gets stuck
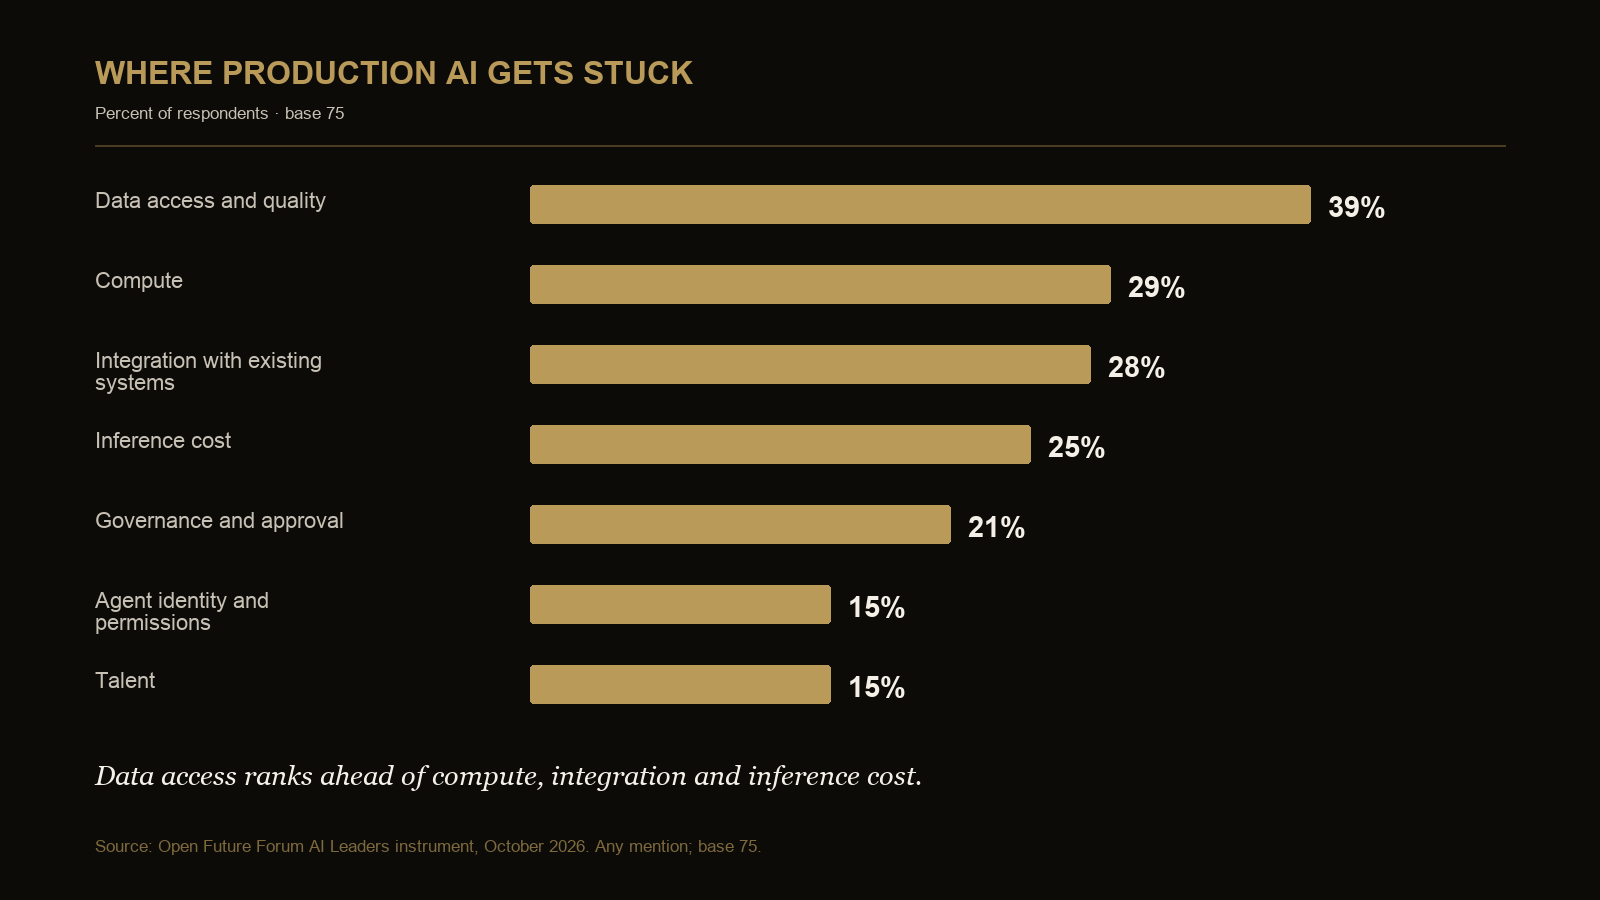
Data access and quality leads at 39 percent. Compute follows at 29, integration at 28, inference cost at 25, governance and approval at 21, agent identity and permissions at 15, and talent at 15 (base 75, any mention).
Data access and quality ranks first, ahead of compute and integration. The remaining responses span infrastructure, cost, governance, identity and talent. The reported bottlenecks therefore extend beyond model selection.
How agents reach enterprise data
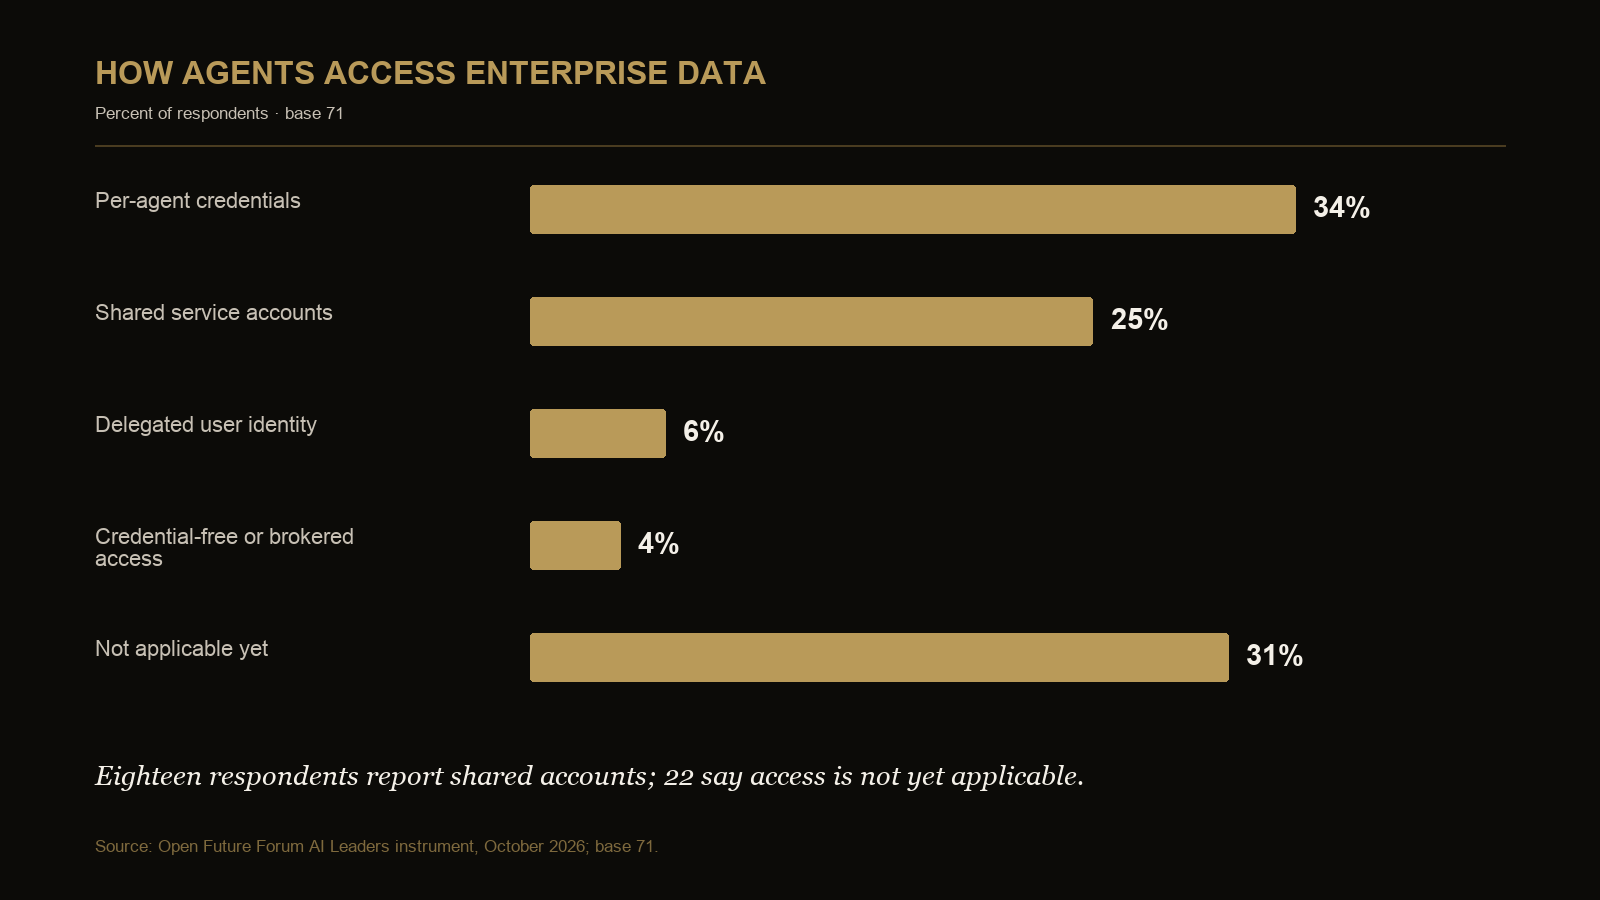
Among all respondents, 34 percent use per-agent credentials, 25 percent use shared service accounts, 6 percent use delegated user identity, 4 percent use credential-free or brokered access, and 31 percent say the question is not yet applicable (base 71).
Among the 49 respondents for whom the question is applicable, 49 percent use per-agent credentials and 37 percent use shared accounts. Delegated identity and brokered access together account for 14 percent. Shared accounts therefore represent a material part of production access in this sample.
Who signs and what they plan to spend
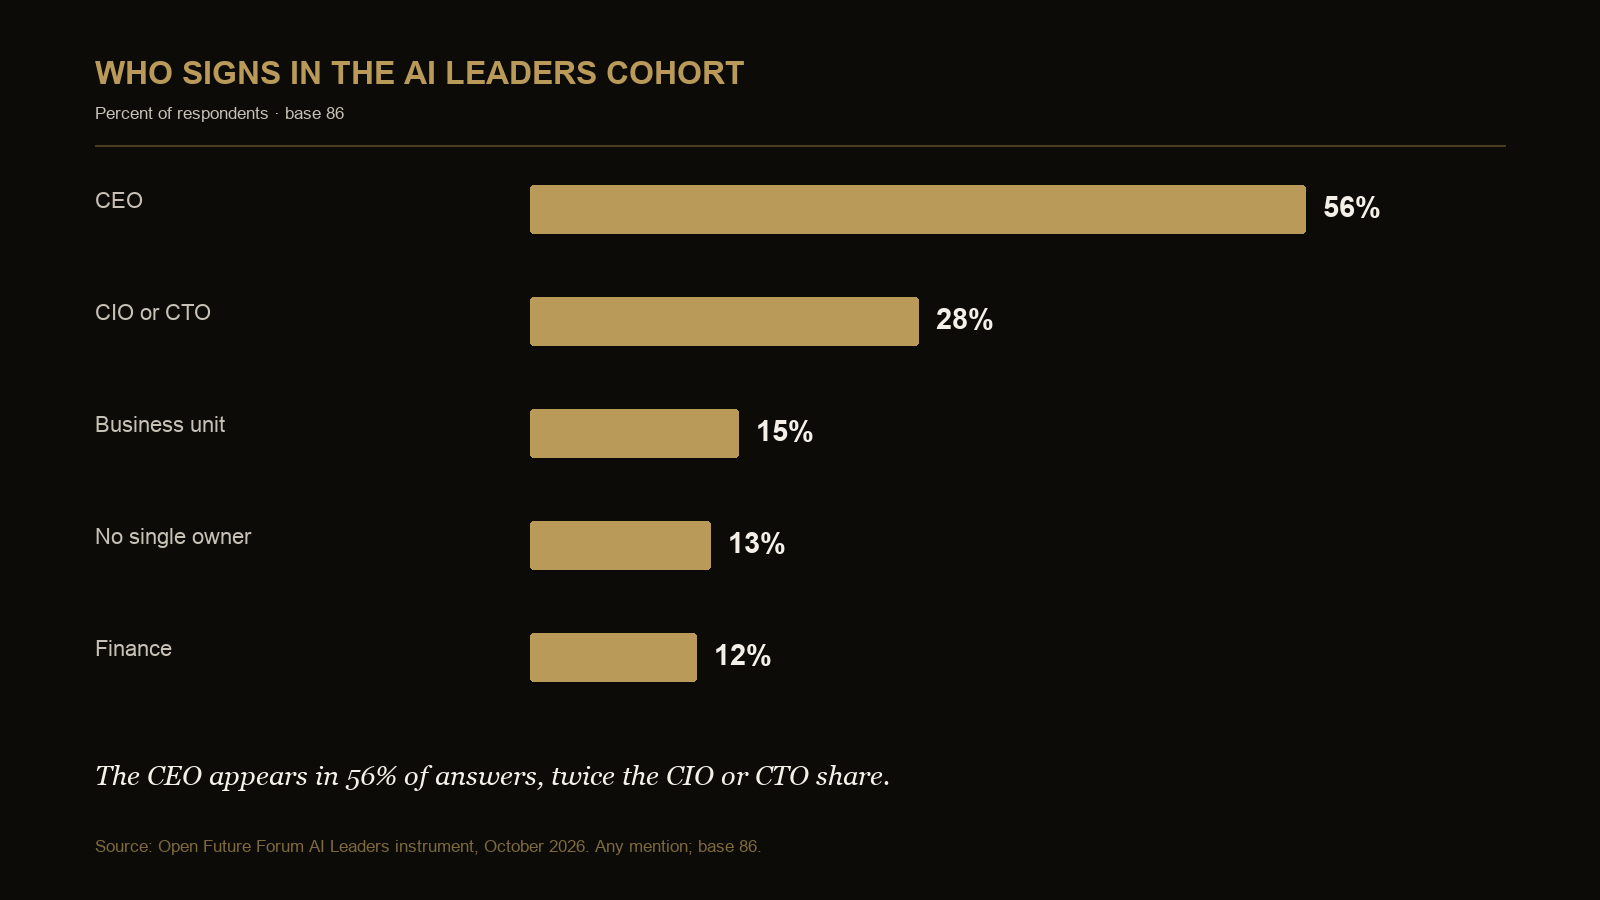
The CEO appears in 56 percent of sign-off answers, the CIO or CTO in 28, a business unit in 15, no single owner in 13 and finance in 12 (base 86, any mention). Buying authority is concentrated with the CEO more often than with the technology or finance functions.
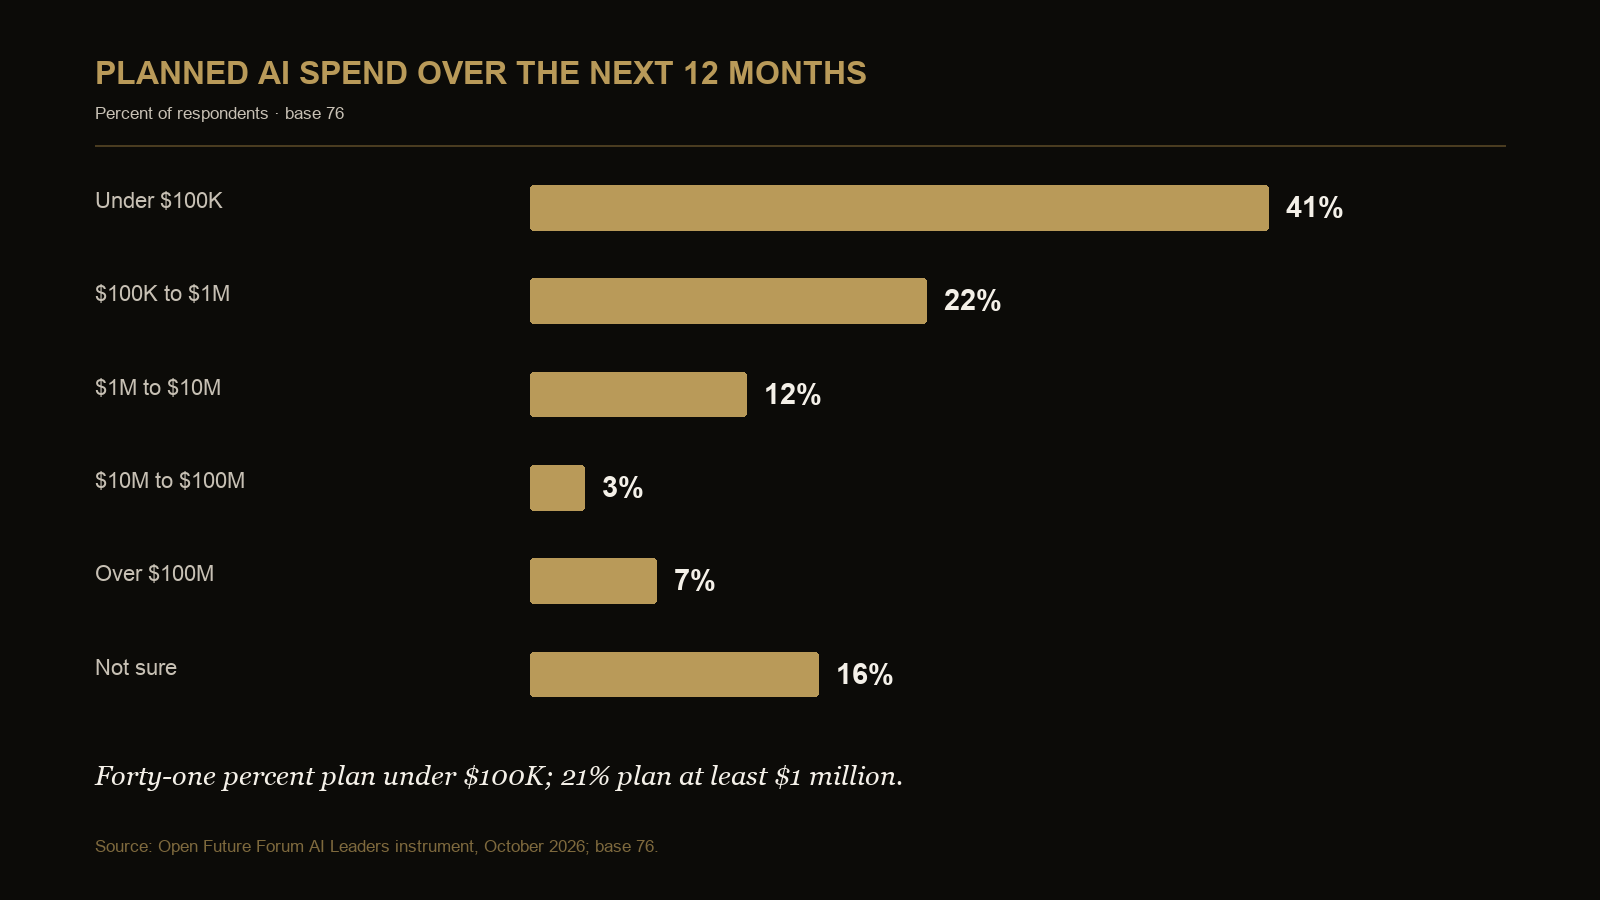
Forty-one percent plan under $100,000 over the next 12 months, 22 percent plan $100,000 to $1 million, 12 percent plan $1 million to $10 million, 3 percent plan $10 million to $100 million, 7 percent plan more than $100 million and 16 percent are not sure (base 76). The distribution is wide enough that a single average would mislead.
What AI leaders want next
Forty-three nonblank, non-invited open-text answers were reviewed qualitatively. Recurring terms and topics include enterprise, adoption, agents, infrastructure, deployment and governance. Respondents also ask how to scale agents reliably and connect them to enterprise systems. This is a thematic reading, not a coded distribution, so no percentage shares are assigned.
Edition 1 evidence book
Who answered
Respondent seat
| Answer | Count | Share |
|---|---|---|
| CEO or founder | 36 | 36% |
| Data or AI leader | 23 | 23% |
| CTO, CIO or engineering | 16 | 16% |
| Other | 10 | 10% |
| Investor | 8 | 8% |
| CMO or marketing | 4 | 4% |
| CISO or security | 2 | 2% |
| Board director | 2 | 2% |
Base 101.
The sample is operator-led but not exclusively technical. CEO and founder respondents are the largest group at 36 of 101, followed by data or AI leaders at 23 and CTO, CIO or engineering respondents at 16.
Production ladder and fleet
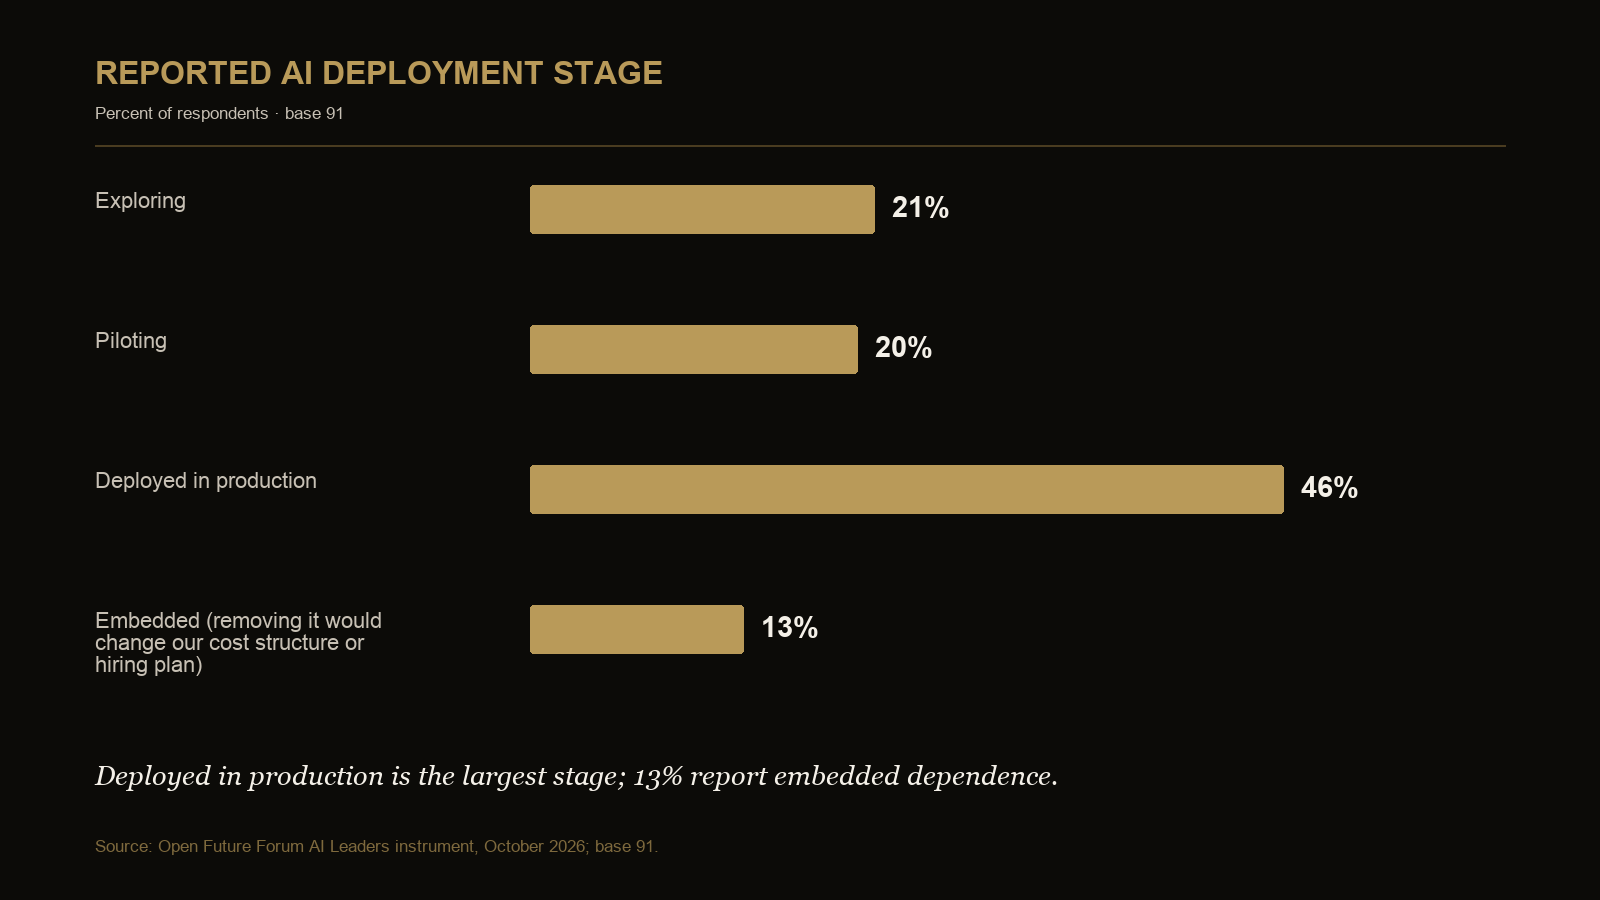
AI maturity
| Answer | Count | Share |
|---|---|---|
| Exploring | 19 | 21% |
| Piloting | 18 | 20% |
| Deployed in production | 42 | 46% |
| Embedded | 12 | 13% |
Base 91.
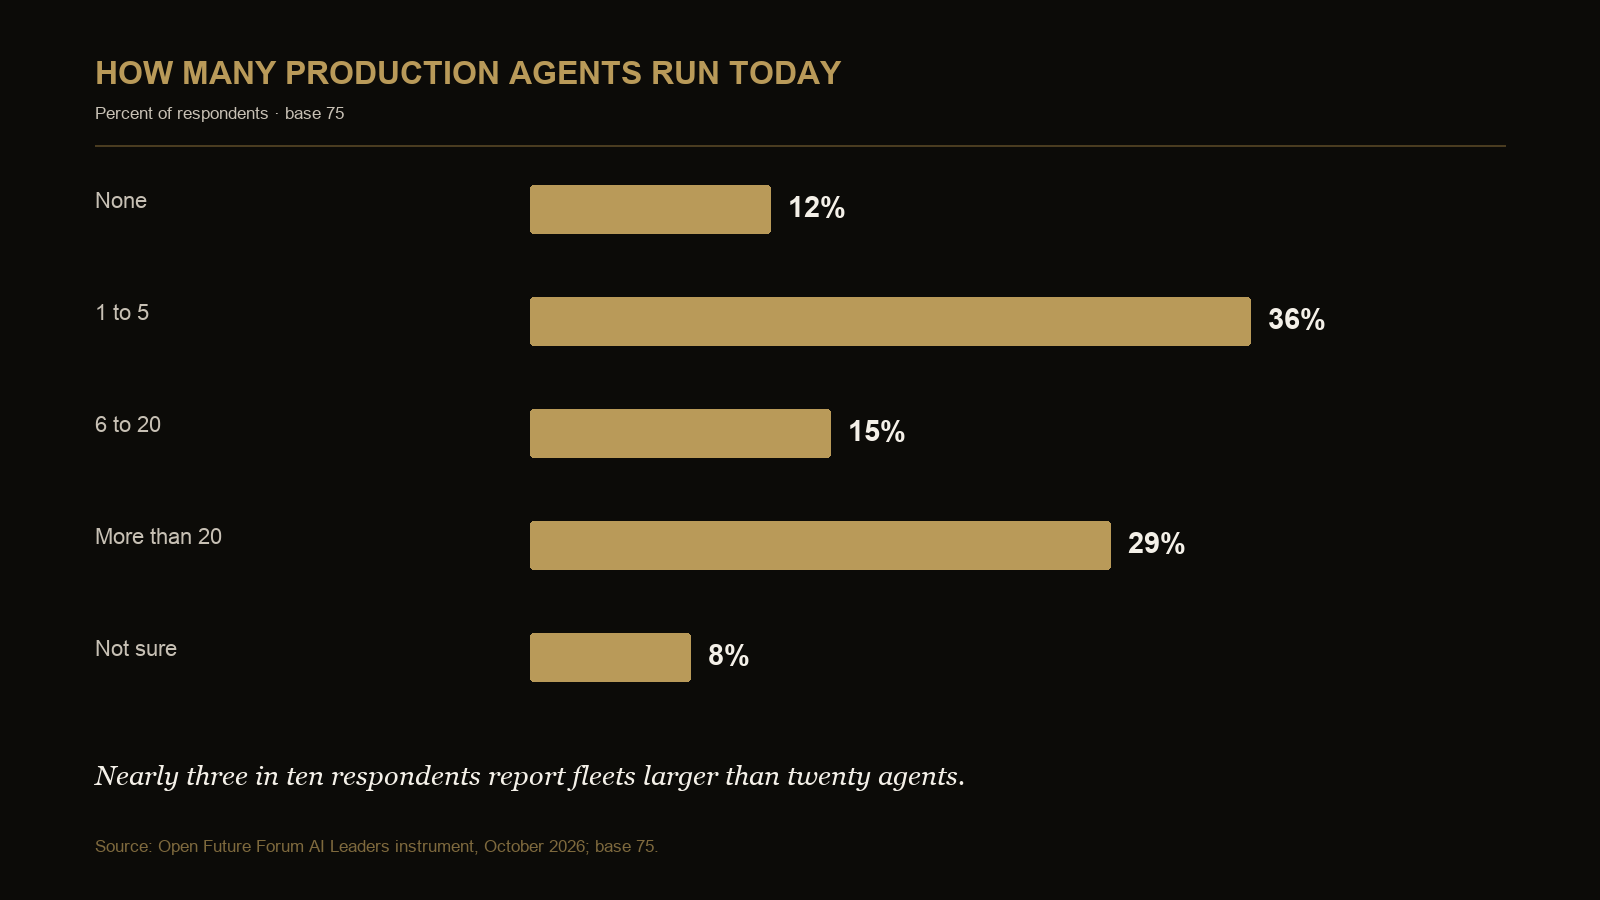
Production-agent count
| Answer | Count | Share |
|---|---|---|
| None | 9 | 12% |
| 1 to 5 | 27 | 36% |
| 6 to 20 | 11 | 15% |
| More than 20 | 22 | 29% |
| Not sure | 6 | 8% |
Base 75.
Fifty-four of 91 respondents are deployed or embedded. Sixty of 75 report at least one production agent, and 22 report more than twenty. The modal fleet is one to five, while 29 percent of the sample reports more than twenty.
Cost visibility
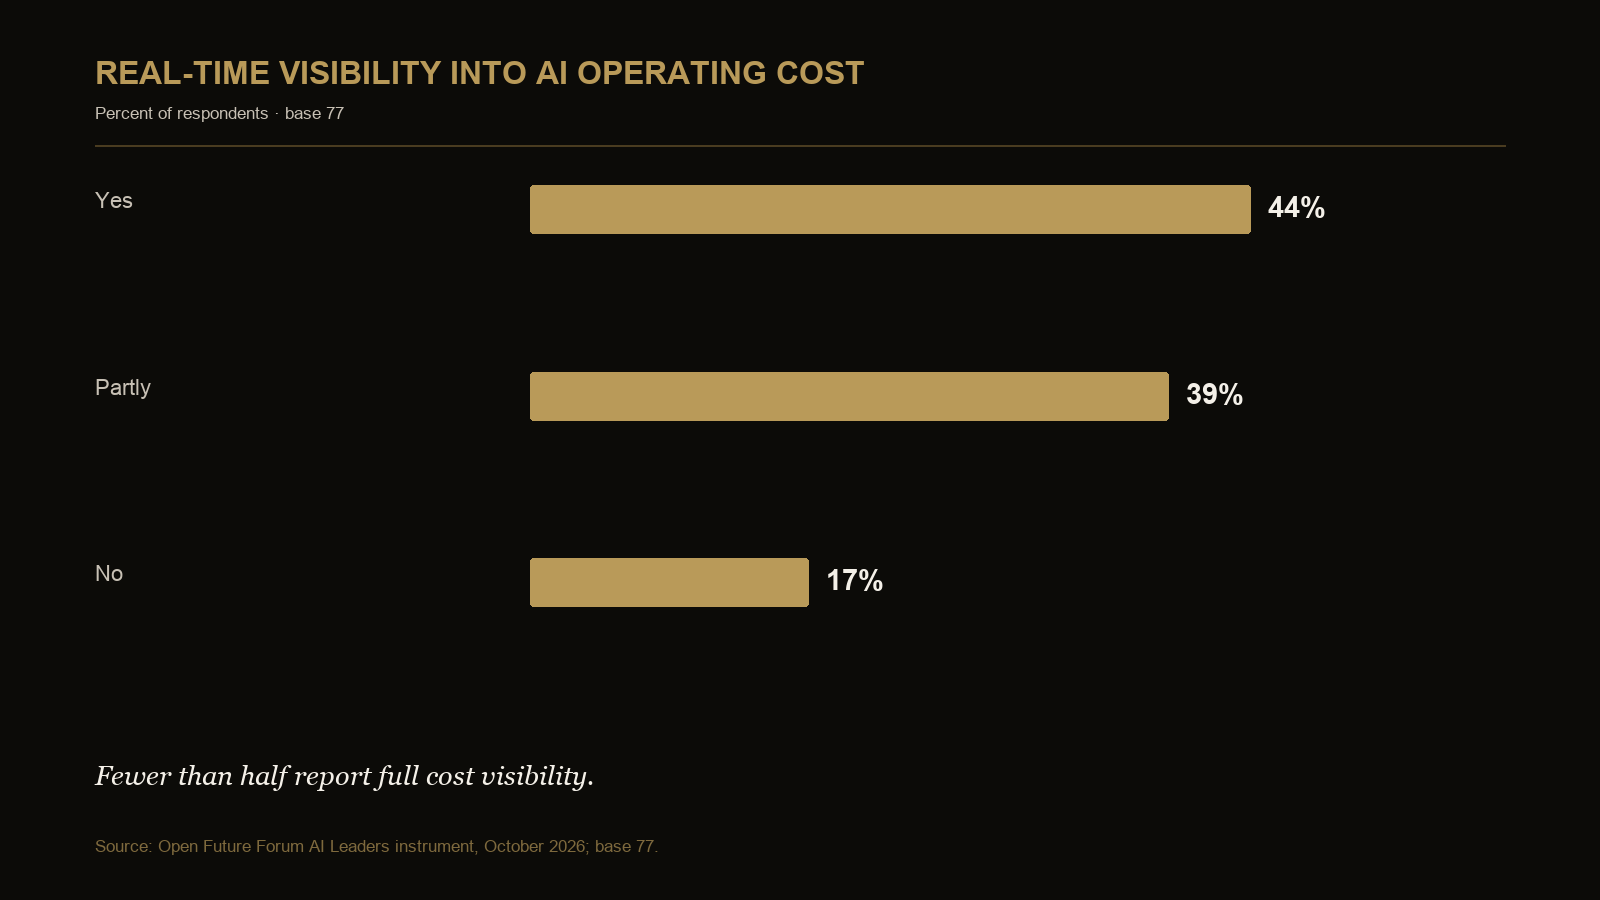
Real-time cost visibility
| Answer | Count | Share |
|---|---|---|
| Full real-time visibility | 34 | 44% |
| Partial visibility | 30 | 39% |
| No real-time visibility | 13 | 17% |
Base 77.
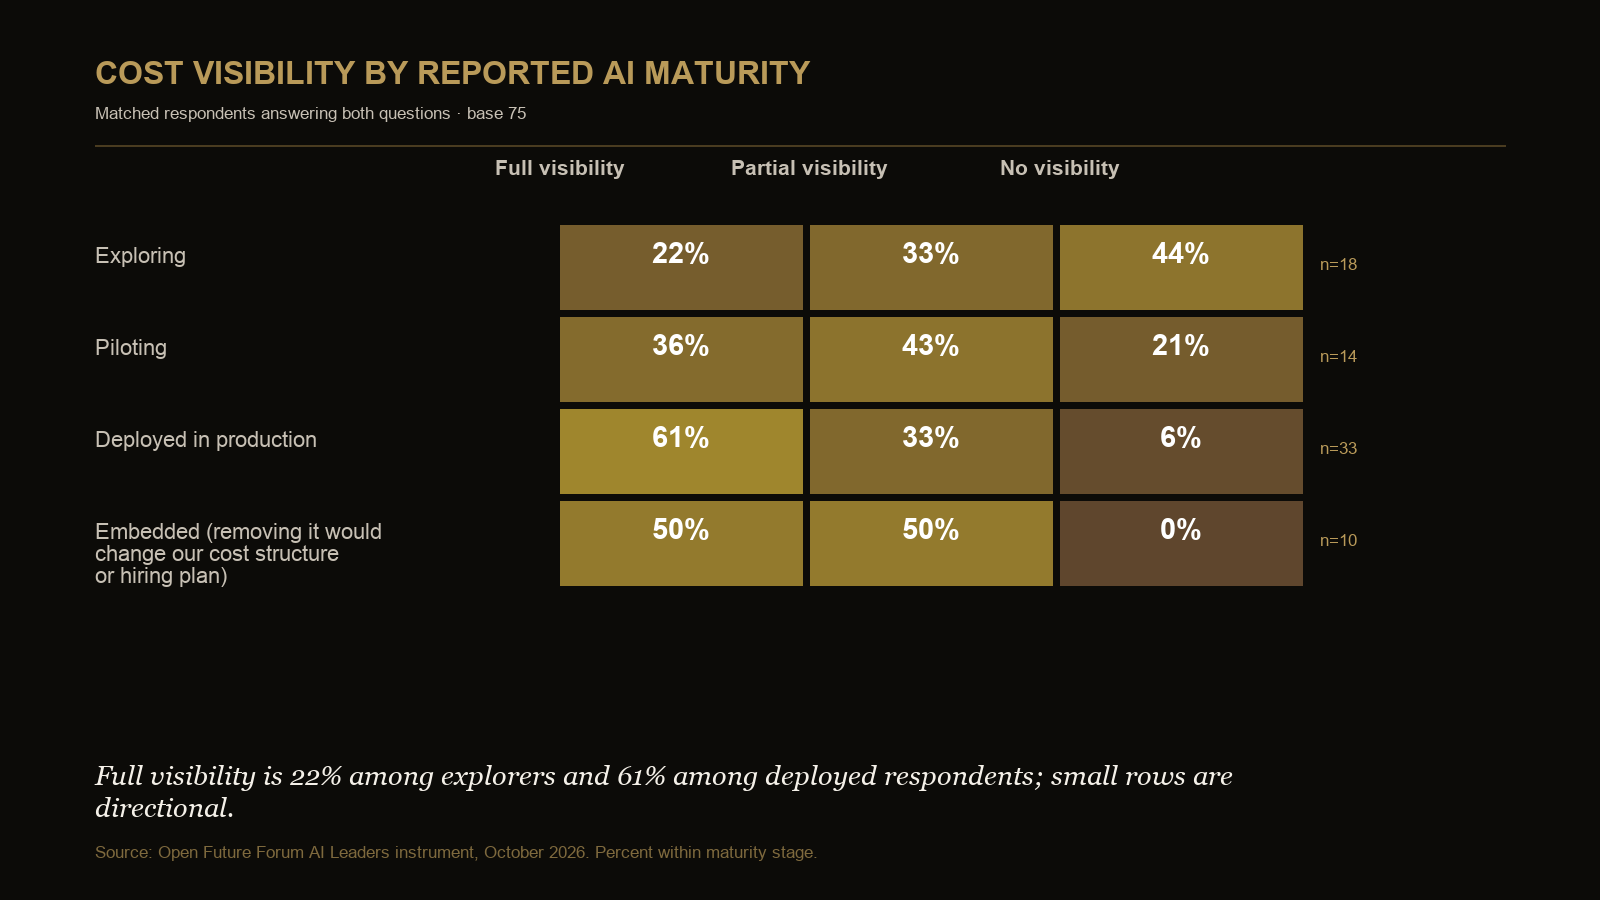
| Group | Base | Full visibility | Partial visibility | No visibility |
|---|---|---|---|---|
| Exploring | 18 | 22% | 33% | 44% |
| Piloting | 14 | 36% | 43% | 21% |
| Deployed in production | 33 | 61% | 33% | 6% |
| Embedded (removing it would change our cost structure or hiring plan) | 10 | 50% | 50% | 0% |
Matched respondents answering both questions; base 75. Small row bases are directional.
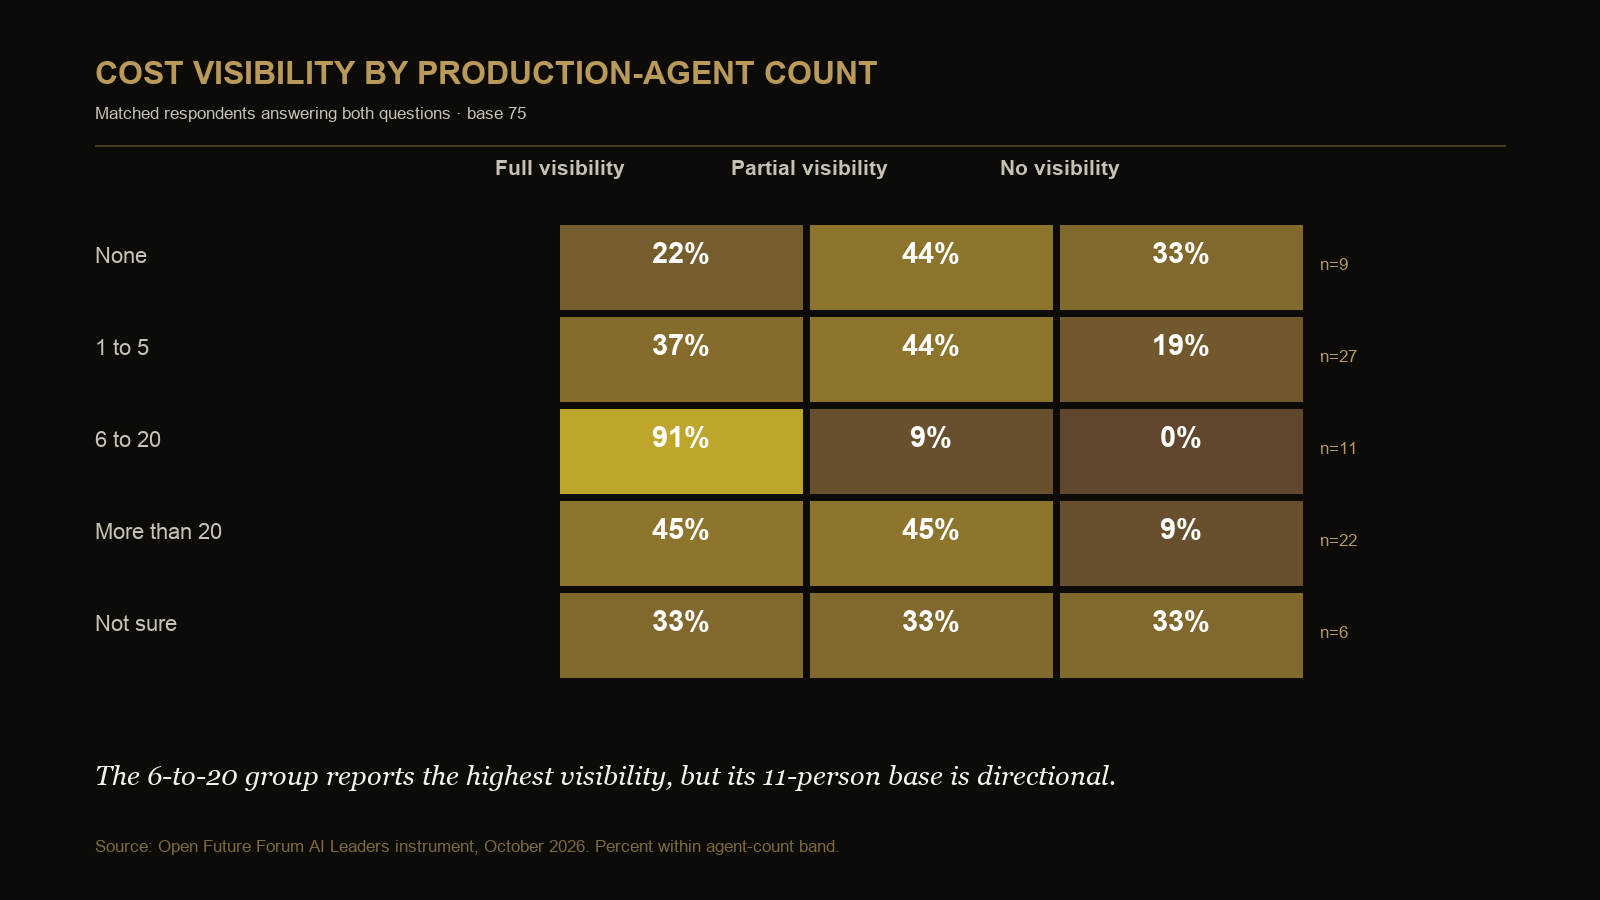
| Group | Base | Full visibility | Partial visibility | No visibility |
|---|---|---|---|---|
| None | 9 | 22% | 44% | 33% |
| 1 to 5 | 27 | 37% | 44% | 19% |
| 6 to 20 | 11 | 91% | 9% | 0% |
| More than 20 | 22 | 45% | 45% | 9% |
| Not sure | 6 | 33% | 33% | 33% |
Matched respondents answering both questions; base 75. Small row bases are directional.
In the matched responses, full visibility is reported by 61 percent of deployed respondents, compared with 22 percent of explorers. Ten of the eleven respondents running six to twenty agents report full visibility, while fleets above twenty split evenly between full and partial visibility. The row bases are small, so these patterns are directional and do not establish causation.
Production bottlenecks
Production bottlenecks
| Answer | Count | Share |
|---|---|---|
| Data access and quality | 29 | 39% |
| Compute | 22 | 29% |
| Integration with existing systems | 21 | 28% |
| Inference cost | 19 | 25% |
| Governance and approval | 16 | 21% |
| Agent identity and permissions | 11 | 15% |
| Talent | 11 | 15% |
Base 75; any mention, so shares can sum above 100 percent.
Data access and quality leads at 39 percent. Compute, integration and inference cost form a second group at 25 to 29 percent. Governance, identity and talent rank lower but are still named by 15 to 21 percent. The bottleneck profile extends well beyond model selection.
Agent access
Access method, all respondents
| Answer | Count | Share |
|---|---|---|
| Per-agent credentials | 24 | 34% |
| Shared service accounts | 18 | 25% |
| Delegated user identity | 4 | 6% |
| Credential-free or brokered access | 3 | 4% |
| Not applicable yet | 22 | 31% |
Base 71.
Access method, applicable responses
| Answer | Count | Share |
|---|---|---|
| Per-agent credentials | 24 | 49% |
| Shared service accounts | 18 | 37% |
| Delegated user identity | 4 | 8% |
| Credential-free or brokered access | 3 | 6% |
Base 49.
Among applicable responses, 49 percent use per-agent credentials, 37 percent use shared service accounts, and 14 percent use delegated or brokered access. The all-respondent table retains the “not applicable” group to show how much of the sample is not yet in scope for the question.
Authority and spend
Signoff in the AI Leaders cohort
| Answer | Count | Share |
|---|---|---|
| CEO | 48 | 56% |
| CIO or CTO | 24 | 28% |
| Business unit | 13 | 15% |
| No single owner | 11 | 13% |
| Finance | 10 | 12% |
Base 86; any mention, so shares can sum above 100 percent.
Planned spend over twelve months
| Answer | Count | Share |
|---|---|---|
| Under $100K | 31 | 41% |
| $100K to $1M | 17 | 22% |
| $1M to $10M | 9 | 12% |
| $10M to $100M | 2 | 3% |
| Over $100M | 5 | 7% |
| Not sure | 12 | 16% |
Base 76.
The CEO appears in 56 percent of sign-off answers, twice the CIO or CTO share. Planned spend ranges from under $100,000 to more than $100 million. Thirty-three of 76 respondents plan at least $100,000, and 16 plan at least $1 million. Because the answer bands are broad and the sample is selective, they should not be converted into a market-size estimate.
Tested against the record
McKinsey's 2026 State of AI reports broader agent scaling alongside cost and financial-impact constraints. IBM's 2026 Cost of a Data Breach Report discusses identity-based controls and auditability for agents. Edition 1 adds two operator measures: a 36-point difference between agent adoption and full cost visibility, and shared service accounts in 37 percent of applicable access answers.
External sources provide context only. Their publishers are not affiliated with this report and do not endorse it.
What this means for the AI leader
A production program should be able to report, without a manual audit, how many agents are running, which identity each agent uses and what each workflow costs. If those records sit in separate systems, management needs a reconciled operating view.
The leading constraint is access to usable enterprise data. Model choice matters, and so do data quality, integration and permissions when assessing whether a system can operate reliably and safely.
What this means for the CEO, CFO and CISO
The CEO is the most frequently named signer, while the control work spans several functions. The CFO needs workflow-level cost accounting: more than half the sample lacks full real-time visibility. The CISO needs attributable access: 37 percent of applicable responses use shared accounts, while 14 percent use delegated or brokered models. The AI leader must coordinate these requirements with finance, security and the business owner.
Questions this report answers
How far has enterprise AI moved into production in this sample?
Fifty-nine percent report deployed or embedded AI (base 91).
How many production agents do respondents report?
Eighty percent report at least one; 29 percent report more than twenty (base 75).
What is the biggest bottleneck for AI in production?
Data access and quality, named by 39 percent (base 75, any mention).
Can respondents see what AI costs to run?
Forty-four percent have full real-time visibility, 39 percent partial visibility and 17 percent none (base 77).
How do AI agents access enterprise data?
Per-agent credentials account for 49 percent and shared service accounts for 37 percent of applicable answers (base 49).
Key citable facts
- Open Future Forum's October 2026 AI Leaders AI Leverage Report finds 59 percent of respondents reporting AI deployed or embedded (base 91).
- The report finds 80 percent running at least one production AI agent, while 44 percent have full real-time visibility into AI operating costs, a 36-point difference across two questions from the same event (bases 75 and 77).
- Data access and quality is the leading production bottleneck at 39 percent, ahead of compute at 29 and integration at 28 (base 75, any mention).
- Among respondents for whom agent data access is applicable, 37 percent use shared service accounts and only 14 percent use delegated or brokered access (base 49).
Methodology and honesty notes
This edition uses first-party questions embedded in the Enterprise AI at Microsoft application flow. Invited-only records are excluded. Respondents are deduplicated by email for each instrument question, with the latest answer retained. Multi-select questions use the any-mention convention. Bases vary because questions were added or completed at different points in the registration flow. No headline is published below 40 responses. The access-method applicable cut excludes respondents who answered “Not applicable yet.”
This is a selective operator sample drawn from Open Future Forum's network. It is not a probability sample of all enterprises. Planned-spend bands are reported as bands; no midpoint estimate or market-size extrapolation is made. The open-text section is a qualitative review of 43 nonblank, non-invited answers, not a coded distribution. Responses are summarized without identifying respondents. No causal claim is made from cross-sectional answers.
Related reading
Citation and editions
Suggested citation: Newlands, M. (2026). AI Leaders AI Leverage Report, Edition 1. Open Future Forum, October 2026. Companion reports: Executive AI Leverage Report, CISO AI Leverage Report, CFO AI Leverage Report and AI Transformation Report. This edition supersedes the September 2026 Preview.
Work These Questions with AI Leaders Peers
The AI Leaders Forum meets through small, off-the-record gatherings. Membership is by application and referral.