One-sentence answer
For a CFO, an AI investment is not ready to scale until its funding route, full workflow cost, measurable benefit, payback window and evidence owner reconcile in one ledger.
Finance finding
Finance is the second-most named sign-off role, at 31 percent. The finance instrument separately shows unsettled funding routes and ROI proof as the leading spending blocker; a different AI Leaders cohort reports incomplete operating-cost visibility. The research does not establish that these conditions occur in the same companies or which condition comes first.
What October adds
The finance sample includes three events beyond the August yacht cohort. The sign-off base is 467, and the budget, blocker and payback questions each have a base of 389. Proving ROI is the leading blocker. In the separate AI Leaders cohort, fewer than half report full real-time visibility into AI costs.
What changed, and what did not
The current edition expands the finance instrument across four events and adds the common sign-off answers from the AI Leaders event. It also brings in one adjacent operating measure: real-time cost visibility from a separate 77-response cohort. Together, those sources let finance compare the promised payback window with the organization's ability to observe current run cost.
This is not a same-respondent trend from September. The expanded question bases contain different event populations, and the cost-visibility question was not asked in the finance instrument. October therefore sharpens the finance operating question without claiming that CFO opinion moved by a particular number of points. The finding that 53 percent expect return inside six months is an expectation, not verified payback; the 44 percent with full cost visibility is self-reported capability, not an audit of the underlying systems.
What remains consistent is the need to separate four kinds of evidence. Funding approval shows where money was authorized. Cost evidence shows what the workflow consumes. Benefit evidence shows what changed. A payback calculation connects the two over a defined period. If one of those records is missing, “ROI” becomes a label rather than a reproducible result.
Where this research comes from
The finance instrument appears across CFOs on the Bay, AI as a Force Multiplier, Buy, Sell, or Wait, and Claude for Finance. The common sign-off question also appears at Enterprise AI at Microsoft. Each question is deduplicated by email with the latest response retained.
Who signs
The CEO appears in 49 percent of answers, finance in 31, the CIO or CTO in 17, no single owner in 13 and an individual business unit in 10 (base 467, any mention). Finance ranks second and is responsible for turning the executive decision into a controlled investment.
Where the budget comes from
Net-new money is named by 41 percent. Thirty-one percent report no clear budget, 20 percent reallocate from software and 19 percent use money that would have gone to headcount (base 389, any mention).
There is no single funding model. Respondents report net-new money, no clear AI budget, software reallocation and money that otherwise might have funded headcount. The cross-sectional instrument does not establish when a purchase occurs relative to budget formalization.
What blocks more spending
Proving ROI leads at 54 percent. Integration follows at 23, security and compliance at 21, data readiness at 20 and talent at 12 (base 389, any mention). The constraints can overlap: a workflow that cannot connect to trusted data, integrate with systems or satisfy security will struggle to produce a result finance can verify.
The payback window
Fifty-three percent expect measurable return inside six months, 26 percent in six to twelve months, 10 percent in twelve to twenty-four months and 14 percent are not sure (base 389, any mention). That expectation places the demand for evidence early in the implementation cycle.
The cost-visibility problem
The AI Leaders cost question adds a separate operating measure. Forty-four percent report full real-time visibility into AI running costs, 39 percent partial visibility and 17 percent none (base 77). Read alongside the finance result, this raises a reconciliation question about benefit and cost evidence; it does not show that the same companies face both conditions or that one came before the other.
October finance evidence
What finance respondents see differently
The cross-functional report owns the full authority matrix. This report narrows the view to the finance seat: the aggregate shows who appears in the decision overall, while the title-classified finance row shows how finance respondents describe that same decision.
| Sign-off answer | Overall instrument (base 467) | Finance respondents (base 67) |
|---|---|---|
| CEO | 49% | 27% |
| CFO or finance | 31% | 67% |
| CIO or CTO | 17% | 9% |
| No single owner | 13% | 13% |
| Individual business unit | 10% | 6% |
Any mention, so each column can sum above 100 percent. The finance row is a title-classified cut of the current common instrument, not a separate finance-only survey.
Finance appears in 31 percent of all answers, while 67 percent of finance respondents name finance. The matching 13 percent “no single owner” result is especially useful in both the overall and finance views: a material group cannot identify one decision owner. See the complete cross-seat matrix in the Executive AI Leverage Report and the chart set in Executive AI Statistics.
Finance-seat evidence versus the overall instrument
| Question | Answer | Overall (base 389) | Finance respondents (base 67) |
|---|---|---|---|
| Budget source | Net-new money | 41% | 43% |
| Budget source | No clear AI budget | 31% | 25% |
| Budget source | Software reallocation | 20% | 22% |
| Budget source | Would-be headcount money | 19% | 19% |
| Spending blocker | Proving ROI | 54% | 48% |
| Spending blocker | Integration | 23% | 13% |
| Spending blocker | Security and compliance | 21% | 21% |
| Spending blocker | Data readiness | 20% | 28% |
| Spending blocker | Talent | 12% | 10% |
| Payback expectation | Under 6 months | 53% | 45% |
| Payback expectation | 6 to 12 months | 26% | 36% |
| Payback expectation | 12 to 24 months | 10% | 12% |
| Payback expectation | Not sure | 14% | 10% |
The overall and finance-seat columns are cuts of the same current instrument. Multi-select funding and blocker answers use any mention; the payback field also permits multi-answer combinations in the export, so its shares can sum above 100 percent.
The finance-seat cut is close to the overall funding mix but differs on proof and timing. Finance respondents name data readiness more often than the aggregate (28 versus 20 percent), name integration less often (13 versus 23 percent), and shift some payback expectation from under six months to six-to-twelve months. Those differences identify the assumptions a CFO should reconcile in the investment ledger; they are descriptive role cuts, not causal effects.
The contrast with CEO and founder respondents is also relevant. Among CEO and founder respondents, 30 percent name would-be headcount money, versus 19 percent among finance respondents. Sixty-seven percent of CEO and founder respondents expect payback inside six months, versus 45 percent among finance respondents. Finance respondents name six-to-twelve months in 36 percent of answers, versus 26 percent among CEO and founder respondents. These differences do not establish that either seat forecasts more accurately. They show where an investment committee should force precision: is the expected benefit a cash reduction, avoided hiring, capacity redeployment or revenue effect, and when should the evidence appear?
Four funding routes
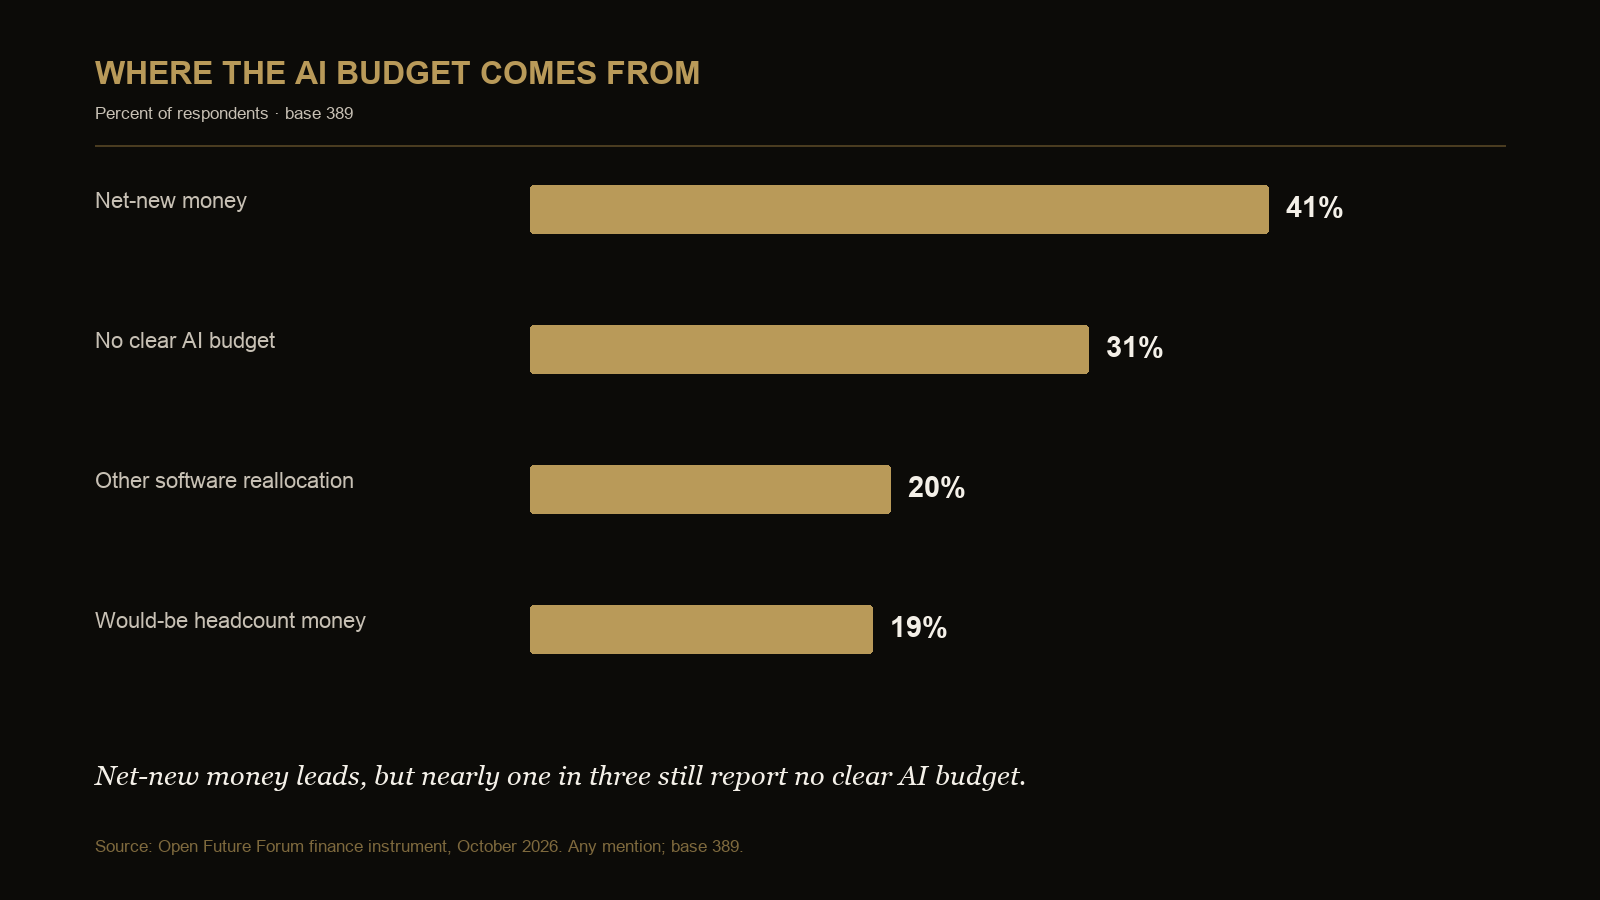
Budget source
| Answer | Count | Share |
|---|---|---|
| Net-new money | 159 | 41% |
| No clear AI budget | 120 | 31% |
| Other software reallocation | 77 | 20% |
| Would-be headcount money | 73 | 19% |
Base 389; any mention, so shares can sum above 100 percent.
Each route creates a different audit trail. Net-new money needs an investment case. Software reallocation needs evidence of the contract or capability displaced. Headcount-linked money needs a distinction between cash savings, avoided hiring and redeployed capacity. “No clear budget” needs an owner before the workflow becomes permanent.
Route 1: net-new money
Net-new money is the most common reported route, at 41 percent. For finance, the central question is whether the new allocation funds a time-bounded experiment, a shared capability or a durable production workflow. Each has a different approval and review pattern. An experiment needs a cap and an evidence date. A shared capability needs an allocation rule. A production workflow needs a cost center and an accountable business owner. The survey does not reveal which accounting treatment respondents use; the control recommendation is to label the route before approval and preserve the decision record.
Route 2: no clear AI budget
Thirty-one percent select “not sure / no AI budget yet,” normalized here as no clear AI budget. That answer does not mean no expenditure occurred. Costs may be distributed across software, cloud, data, consulting or functional budgets, or the respondent may simply lack visibility. Finance should treat it as a reconciliation prompt: identify the contracts, usage charges, internal labor and control costs attached to each live workflow, then assign an owner for future variance.
Route 3: software reallocation
Twenty percent name money reallocated from other software. A reallocation claim needs two records: the AI cost being approved and the software cost actually reduced, retired or avoided. If the old contract remains, the company may be adding cost rather than substituting it. If the new workflow recreates a capability once bundled into the displaced product, implementation, integration and support costs belong in the comparison.
Route 4: would-be headcount money
Nineteen percent name money that would have gone to headcount. This route requires the most careful vocabulary. A role removed from an approved plan can be an avoided cost; hours released but retained are capacity; an actual reduction in payroll can become a cash benefit once it appears in finance records. The survey does not establish which of these occurred. A CFO should keep the categories separate so a productivity claim is not automatically booked as savings.
Because the funding question is multi-select, these routes can overlap and shares can exceed 100 percent. A workflow may combine a new allocation with software reallocation or headcount-linked funding. The ledger should preserve every material source instead of forcing one exclusive label.
The proof window
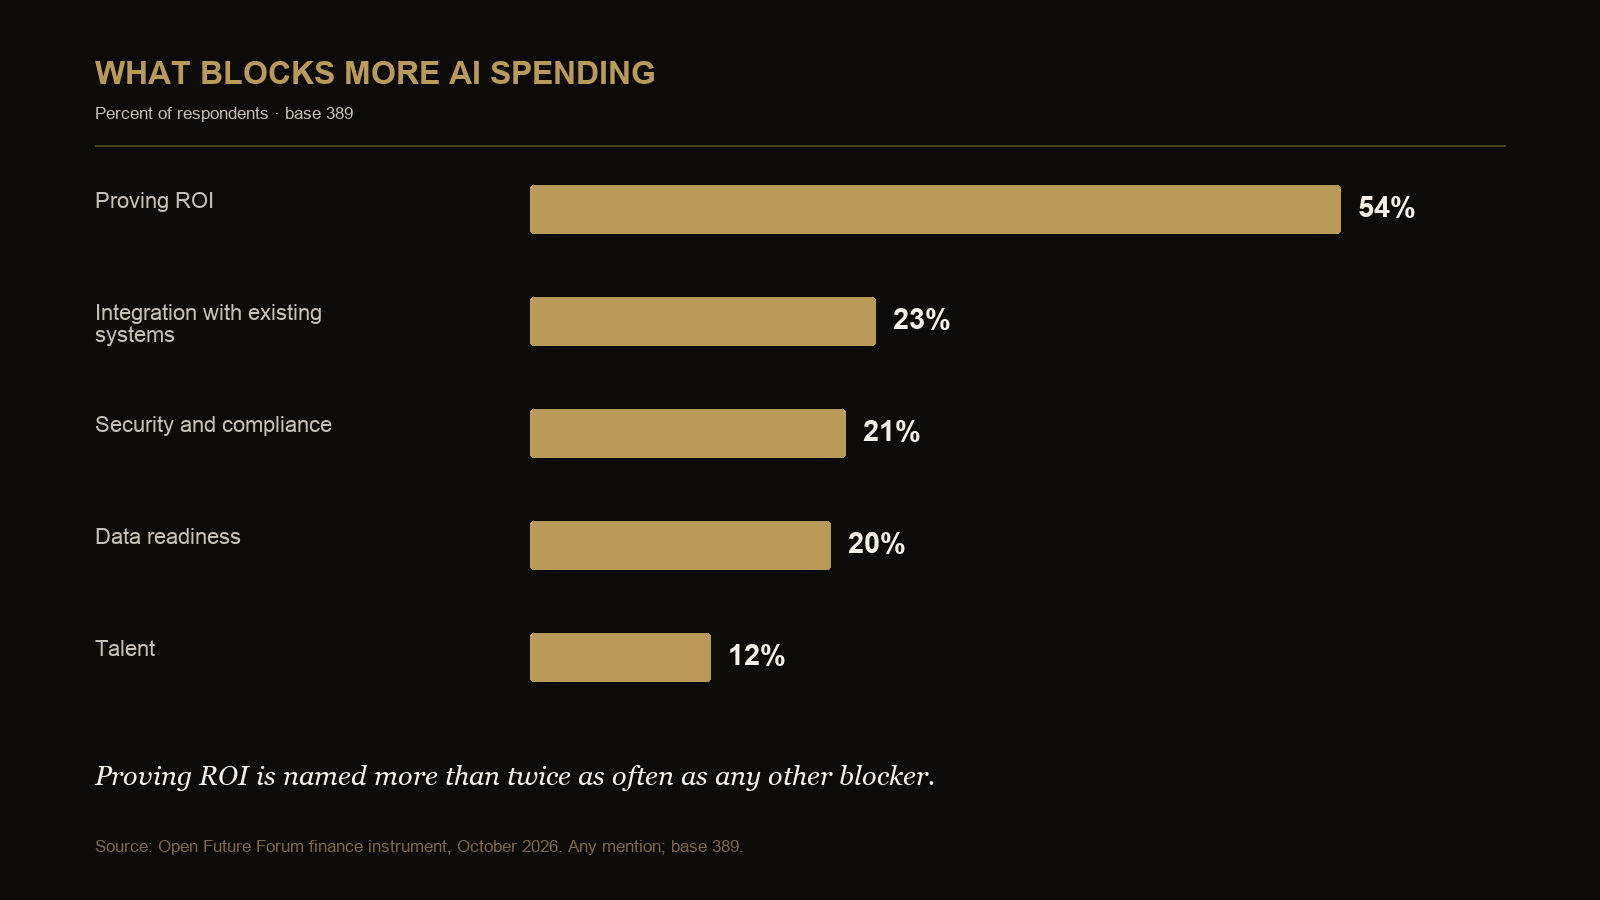
Spending blockers
| Answer | Count | Share |
|---|---|---|
| Proving ROI | 211 | 54% |
| Integration with existing systems | 89 | 23% |
| Security and compliance | 80 | 21% |
| Data readiness | 79 | 20% |
| Talent | 45 | 12% |
Base 389; any mention, so shares can sum above 100 percent.
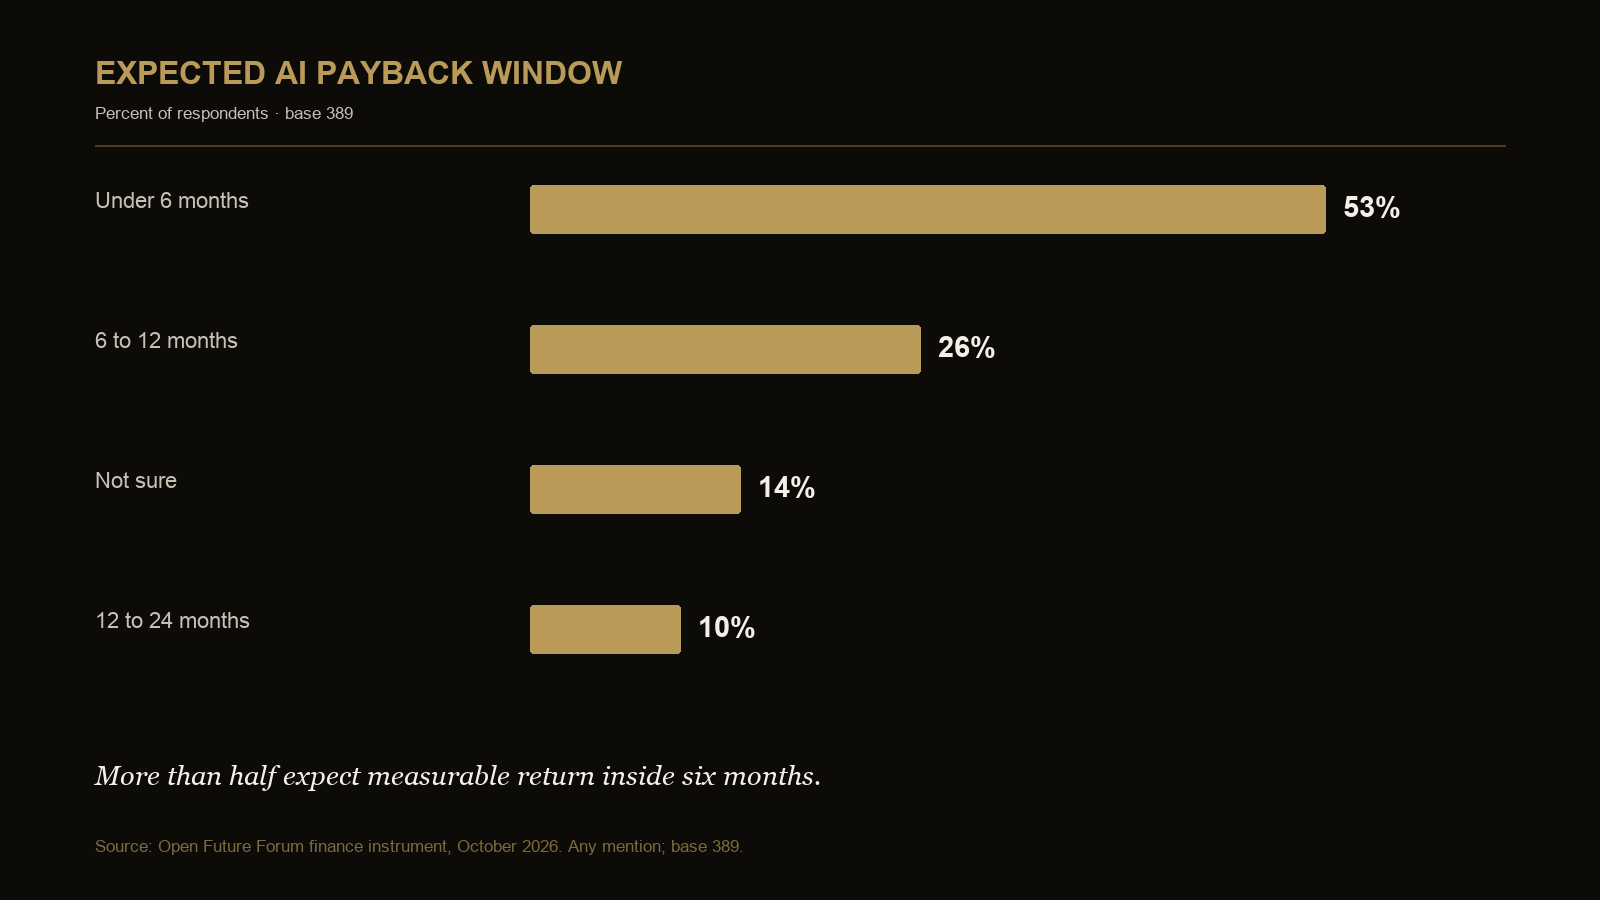
Payback expectation
| Answer | Count | Share |
|---|---|---|
| Under 6 months | 208 | 53% |
| 6 to 12 months | 101 | 26% |
| 12 to 24 months | 37 | 10% |
| Not sure | 53 | 14% |
Base 389; any mention, so shares can sum above 100 percent.
In the same 389-response instrument, 54 percent name ROI proof as a blocker and 53 percent expect a result inside six months. Companies therefore face a short window for producing an auditable result.
That pairing should not be read as proof that respondents who demand six-month payback are the same respondents who name ROI as a blocker. It is a comparison of aggregate answers within the same question base, not a matched subgroup analysis. Its use is operational: design the evidence process early enough to test the stated horizon. Waiting until month five to agree on a baseline or cost allocation makes a six-month review largely ceremonial.
Cost visibility after approval
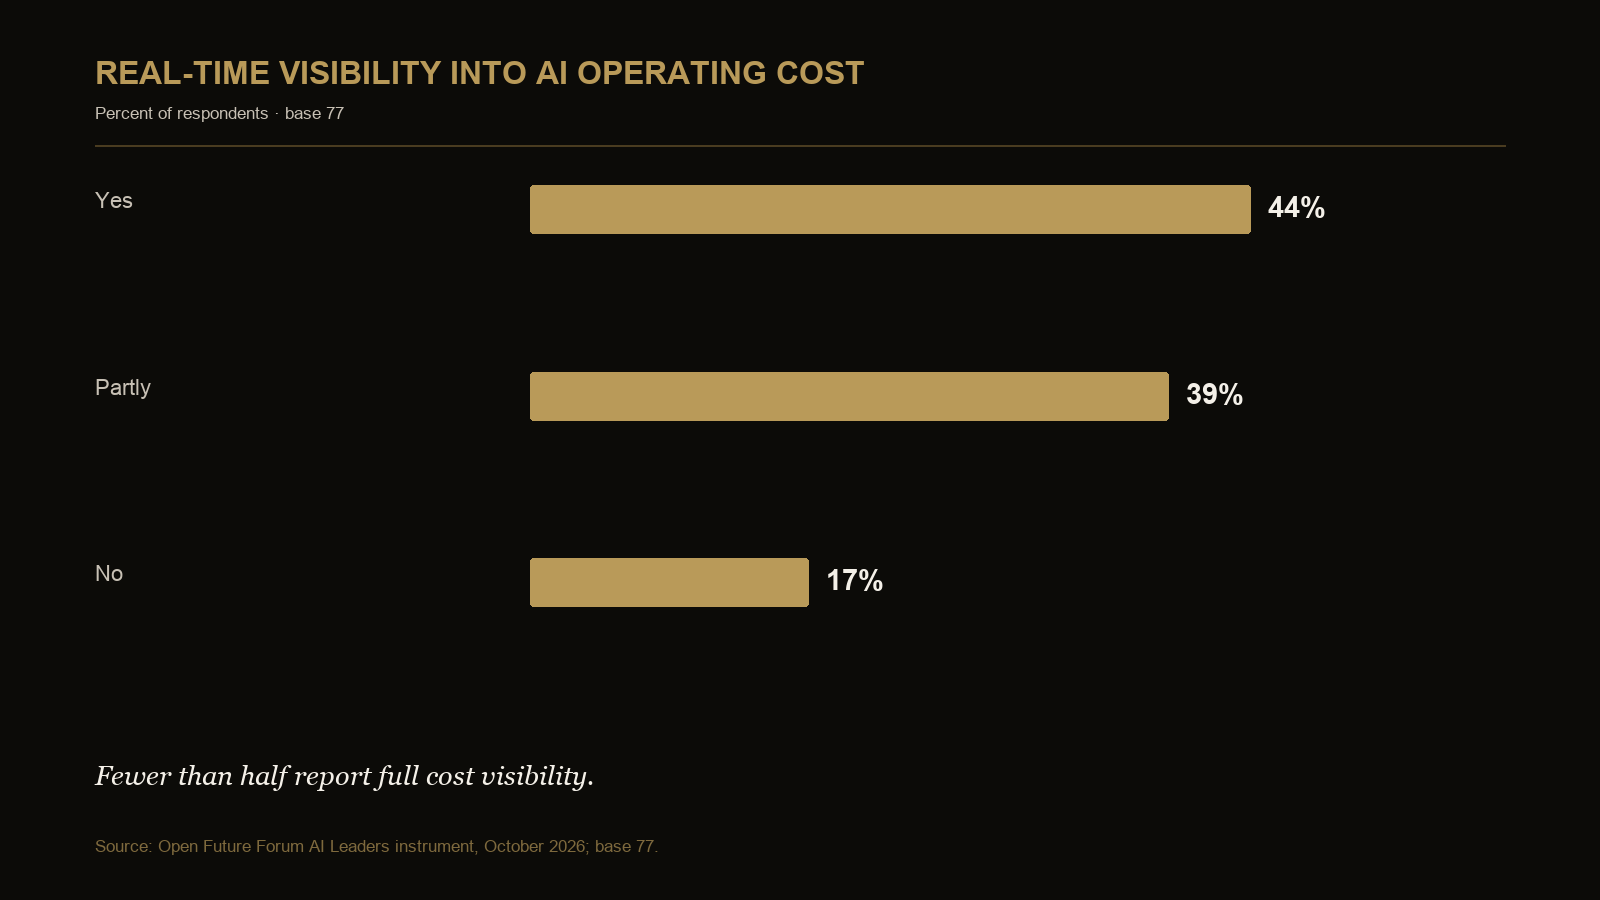
Real-time AI operating-cost visibility
| Answer | Count | Share |
|---|---|---|
| Full real-time visibility | 34 | 44% |
| Partial visibility | 30 | 39% |
| No real-time visibility | 13 | 17% |
Base 77.
The cost-visibility question comes from the AI Leaders cohort rather than the finance instrument and should not be merged statistically with the 389-response budget line. It is relevant to the CFO: 43 of 77 respondents report only partial or no real-time visibility. Finance can approve the envelope while remaining unable to allocate the run cost to a workflow.
External context
Deloitte's 2026 CFO Signals identifies AI cost uncertainty and transparency as CFO concerns, while McKinsey's 2026 State of AI finds operating costs already constraining some AI use. A spending plan is incomplete if the company cannot identify where costs land or how return will be measured.
| Evidence source | Relevant question | Contribution of this report | Limit on comparison |
|---|---|---|---|
| Deloitte, CFO Signals 2Q 2026 | How finance leaders are approaching AI cost and transparency | First-party funding-route, blocker and payback answers, plus a finance-seat cut | Different instruments and samples; results should not be combined |
| McKinsey, State of AI 2026 | How organizations are scaling AI and encountering operating-cost constraints | A workflow-led finance framework connecting approval, run cost and benefit evidence | External findings provide context, not validation of a specific OFF percentage |
The agreement is at the level of the management problem: AI economics requires visibility and evidence. Open Future Forum's distinctive contribution is the connection among four reported funding routes, a short expected payback window and incomplete real-time cost visibility. None of the studies is treated as a benchmark for a company's required return.
What this means for the CFO
Create an AI cost ledger at workflow level. Each production workflow needs a business owner, model and infrastructure cost, data and integration cost, risk-control cost, and agreed benefit measure. A central AI budget can fund experimentation; it cannot substitute for unit economics.
A finance gate from pilot to permanent funding
Before a pilot starts, fix the baseline, measurement window, spending cap and evidence owner. Before it reaches production, identify recurring model, infrastructure, data, integration, review and control costs. At the first benefit review, separate observed operating change from the financial interpretation: faster work may release capacity without reducing cash cost. At the permanent-funding gate, require an accountable business owner to accept the target, actual result, full run cost and next decision date.
The gate should allow four decisions: continue within the existing boundary, remediate a missing control or evidence field, expand after validated results, or stop when the business case or control case fails. “Continue the pilot” should not become a fifth indefinite status.
Finance failure modes to surface
- Envelope economics: the total AI budget is known, but no one can calculate cost per workflow, transaction or approved output.
- Gross-benefit reporting: a team reports hours or revenue influence without subtracting implementation and run costs.
- Counterfactual drift: avoided hiring is claimed without an approved role, forecast or capacity need that predates the AI decision.
- Double counting: the same released hours support both a cost-saving claim and a revenue-contribution claim.
- Baseline after launch: the comparison period is chosen only after results are visible.
- Permanent pilot: recurring spend continues without a dated decision on ownership, controls or validated value.
These are recommended audit tests, not frequencies measured by the survey.
Workflow ROI and cost ledger
Use a separate row for each production workflow and update it on the same cadence as the operating costs. Do not combine cash savings, avoided hiring and redeployed capacity into one benefit number; they have different financial meanings and require different evidence.
| Ledger field | What to record | Calculation or decision rule | Required evidence |
|---|---|---|---|
| Workflow and business owner | The bounded process, accountable executive and operating team | One owner must be able to approve continued use | Process map and named owner |
| Funding route | Net-new money, software reallocation, would-be headcount money or another documented source | Reconcile the approved route to the general ledger and cost center | Approval record, budget code and displaced-spend record where applicable |
| Baseline volume and unit | Pre-AI transactions, cases, campaigns, documents or other relevant unit | Fix the baseline period before claiming improvement | Timestamped source-system extract |
| Full monthly run cost | Model, infrastructure, data, integration, monitoring, security, legal and human-review costs | Sum costs attributable to the workflow; disclose allocation assumptions | Vendor bills, usage logs, internal allocations and reviewer hours |
| Cash benefit | Expense that actually leaves the run rate | Count only realized reductions supported in finance records | General-ledger or payroll evidence |
| Avoided cost | Approved expense or hiring that did not occur because capacity was created | Keep separate from cash benefit and document the counterfactual | Approved plan, requisition or forecast comparison |
| Redeployed capacity | Hours released and assigned to documented higher-value work | Hours saved × validated loaded rate; do not label as cash savings | Time study, quality check and reassignment record |
| Revenue or margin contribution | Incremental conversion, retention, price, volume or margin linked to the workflow | Compare with a defined control, prior period or agreed attribution method | CRM, commerce or finance-system evidence |
| Net benefit and payback | Validated benefits less full run cost | Payback begins when cumulative validated net benefit covers implementation cost | Signed calculation with period and assumptions |
| Decision status | Continue, remediate, expand, pause or stop | Set the threshold and next review date before the review | CFO and business-owner decision record |
Evidence checklist for an AI investment review
- The workflow has one business owner, one technical owner and one finance reviewer.
- The baseline predates the claimed benefit and comes from a named source system.
- Implementation cost and recurring run cost are separated.
- Model, infrastructure, data, integration, monitoring, security, legal and human-review costs are included or explicitly marked not applicable.
- Cash savings, avoided cost, redeployed capacity and revenue contribution are reported separately.
- Quality, error, risk and customer-impact measures sit beside the financial measure so speed is not mistaken for value.
- The measurement window matches the claimed payback period.
- Attribution assumptions, exclusions and manual adjustments are visible.
- The ledger records the decision, reviewer, evidence date and next review date.
- A stop or remediation rule exists if evidence is late, costs are incomplete or the target is missed.
For a worked method that assigns direct and shared costs, reserved capacity and human review to one workflow, use How to Allocate AI Costs to Individual Workflows.
Implications for adjacent roles
CEO and business owner: define which benefit is being promised and accept the workflow-level result. The CEO-and-founder seat's shorter payback expectation makes alignment with finance especially important.
Technology and AI leader: provide usage, model, infrastructure, data and integration costs in a form finance can allocate. A platform bill without workflow tags cannot support unit economics.
CISO and general counsel: make control, review and contract costs visible rather than treating them as overhead outside the AI case. They also need escalation rights when a workflow expands its data or action boundary.
People leader: distinguish a removed position, an avoided requisition and redeployed employee time. Each may be strategically valuable, but only some produce a near-term cash effect.
Board or investor: ask whether the reported benefit reconciles to the ledger and whether the measurement window matches the stated payback horizon. This report is a question set for that review, not financial advice or an accounting standard.
Definitions used in this report
Funding route is the reported source of money for AI. Multi-select answers use any mention, so one respondent may appear in several routes.
Full workflow cost means the costs attributable to operating the bounded use case, including model, infrastructure, data, integration, monitoring, security, legal and human review where applicable. This is a recommended ledger definition, not a surveyed variable.
Cash benefit is a realized reduction that appears in financial records. Avoided cost is approved future spend that did not occur. Redeployed capacity is time released and reassigned while the cost remains. The survey does not quantify these three categories separately.
Measurable return is the wording represented by the payback question. It records respondent expectation; it is not independently verified return on investment.
Real-time cost visibility is a self-reported response from the separate AI Leaders cohort. It should not be described as a finance-only result or a tested accounting capability.
Finance respondent is a title-classified seat within the common instrument, not a separate probability sample of CFOs.
Questions this report answers
Which AI funding routes require different accounting treatment?
Net-new money, software reallocation, would-be headcount money and work proceeding without a clear AI budget should not share one accounting narrative. They are reported by 41, 20, 19 and 31 percent respectively (base 389, any mention), and each requires different evidence of source, displacement and benefit.
What makes an AI ROI claim auditable?
An auditable claim ties a dated baseline and defined outcome to the full workflow cost, separates types of benefit, names the source systems and records the reviewer. That discipline matters because proving ROI is the leading blocker at 54 percent (base 389).
When should an AI workflow receive permanent funding?
Permanent funding should follow validated workflow economics rather than the existence of a pilot. Fifty-three percent expect measurable return inside six months, 26 percent in six to twelve months, 10 percent in twelve to twenty-four months and 14 percent are not sure (base 389, any mention).
Why is real-time run-cost visibility a CFO issue?
Without current run cost, finance cannot calculate unit economics, variance or payback reliably. In the separate AI Leaders cohort, 44 percent report full real-time visibility, 39 percent partial visibility and 17 percent none (base 77).
Does headcount-linked funding prove that AI has reduced jobs?
No. Nineteen percent name money that would have gone to headcount (base 389, any mention), but the question does not establish whether a role was removed, a requisition was avoided, work was redeployed or a cash saving occurred. Those outcomes require separate evidence.
Why do CEO and finance payback answers differ?
The title-classified cuts show different expectations: 67 percent of CEO and founder respondents name under six months, compared with 45 percent of finance respondents; finance respondents more often name six to twelve months, 36 versus 26 percent. The data does not explain causation or forecast accuracy. It identifies an assumption the two seats should reconcile.
Can the 44 percent cost-visibility result be combined with the finance base?
No. The 44 percent comes from 77 AI Leaders respondents, while funding, blockers and payback use the 389-response finance instrument. The result is adjacent operating evidence and is labeled separately throughout this report.
Key citable facts
- Finance appears in 31 percent of AI sign-off answers in Open Future Forum's October 2026 data (base 467, any mention).
- Thirty-one percent report no clear AI budget and 19 percent use money that would have gone to headcount (base 389, any mention).
- Fifty-four percent name proving ROI as a blocker to more AI spending (base 389).
Methodology and honesty notes
The finance base combines different event cohorts answering the same wording. Respondents are deduplicated per question by email. Invited-only rows are excluded. Multi-select answers use any mention, so percentages can sum above 100 percent. The cost-visibility question comes from the AI Leaders cohort and is not treated as a finance-only sample.
Related reading
- Executive AI Leverage Report
- AI Leaders AI Leverage Report
- Executive AI Statistics
- Where Do AI Budgets Come From in 2026?
- Do Companies Have Real-Time Visibility into AI Operating Costs?
Citation and editions
Suggested citation: Newlands, M. (2026). CFO AI Leverage Report, Edition 4. Open Future Forum, October 2026. This edition supersedes Edition 3, September 2026.
Work These Questions with Finance Peers
The CFO Executive Forum meets through small, off-the-record gatherings. Membership is by application and referral.