One-sentence answer
The CEO's AI responsibility does not end at purchase approval; it is to assign who can launch, expand, pause and stop each production workflow, then require current evidence on value, cost, access and control.
CEO finding
The CEO is the most-named signer, but approval does not guarantee production control. An executive can approve AI without knowing what every agent costs, which identity it uses or which data dependency could stop it. Accountability has to extend from the purchase decision to each production workflow.
What October adds
Across the expanded common sign-off base, the CEO ranks first. Current title classification also provides recalculated CEO and founder cuts for sign-off, funding and payback. The new operating measures are 80 percent production-agent adoption, 44 percent full cost visibility and data access as the leading bottleneck. Because no CEO-only instrument was collected, none of these cross-sectional role or cohort comparisons is presented as October movement.
What changed, and what did not
October expands the common sign-off base and adds production evidence from the AI Leaders instrument. It also recalculates the CEO-and-founder title cuts from the current common and finance instruments. That combination makes this edition more useful for governing the handoff from executive approval to live operation.
It does not create a CEO panel or a new CEO-only survey. The 49 percent aggregate sign-off result, the 56 percent AI Leaders result and the 80 percent CEO-or-founder seat result answer different questions about different analytical views. They are not three observations of the same population and should not be averaged. CEO private-dinner exports are roster records rather than answers to these research questions and are not used to create a CEO finding.
The operating measures are also cross-cohort evidence. They establish what information a signing executive should request; they do not show that a particular CEO personally lacks cost visibility, uses a shared credential or faces a data bottleneck. The conclusion is therefore about decision design: concentrated approval needs an explicit chain of delegated operating authority.
Where this research comes from
This report combines the expanded common buying question, the current finance instrument and the AI Leaders operating instrument. The CEO private-dinner exports contain roster data but not these research questions, so they are not used to infer new buying metrics.
The signature
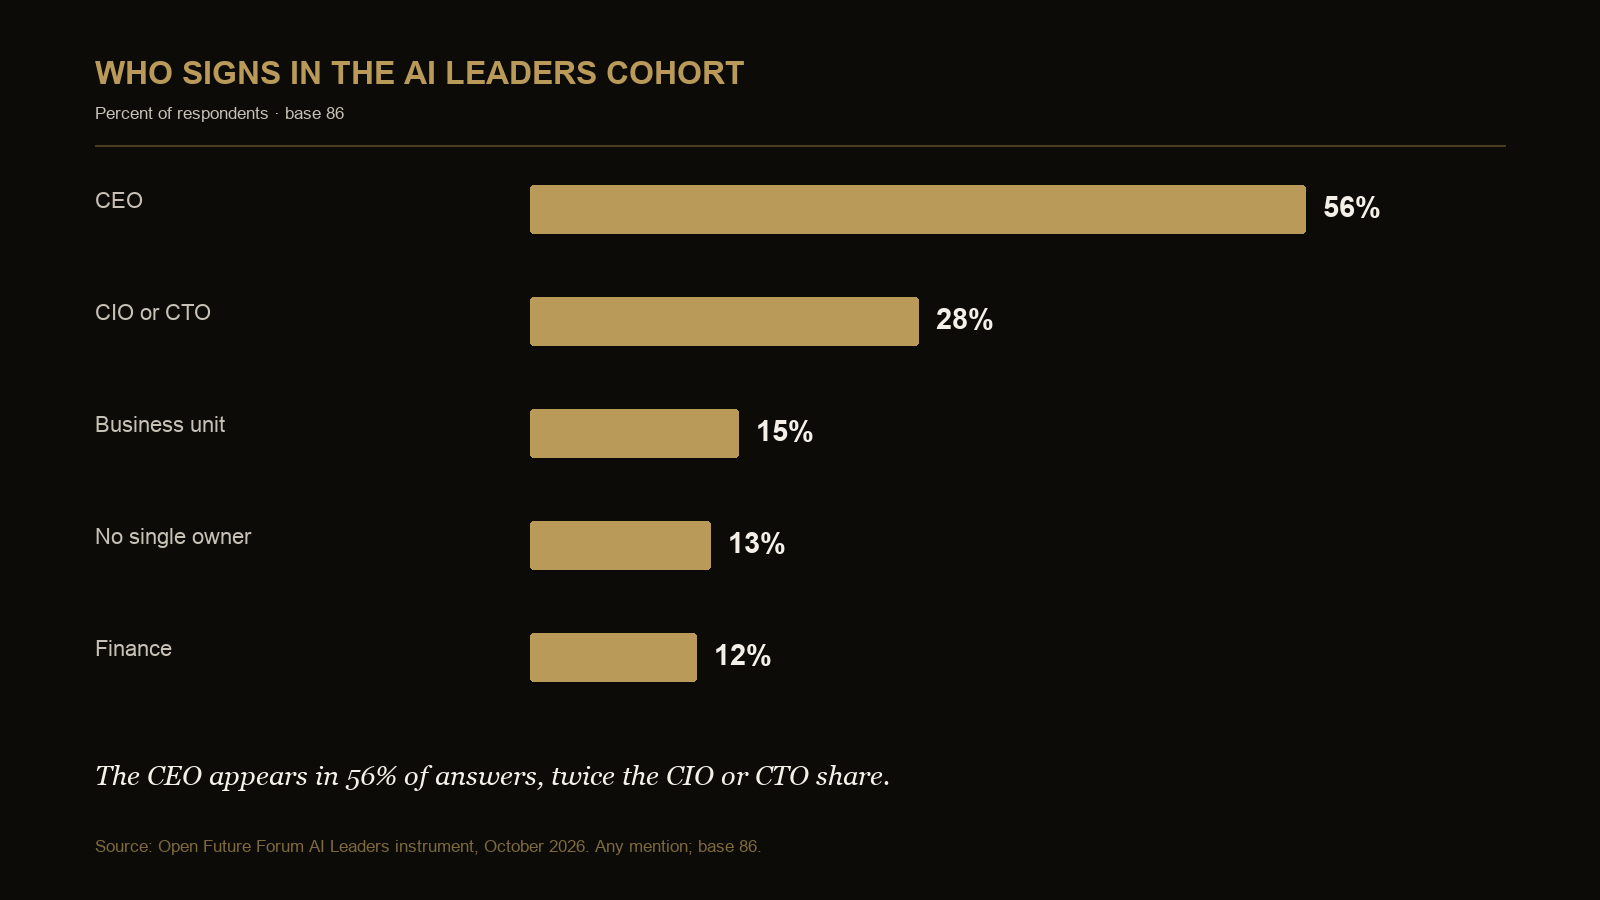
The CEO appears in 49 percent of common sign-off answers (base 467, any mention) and 56 percent of the Microsoft cohort's answers (base 86, any mention). The CEO ranks first in both the combined common instrument and the AI Leaders cohort.
The operating blind spot
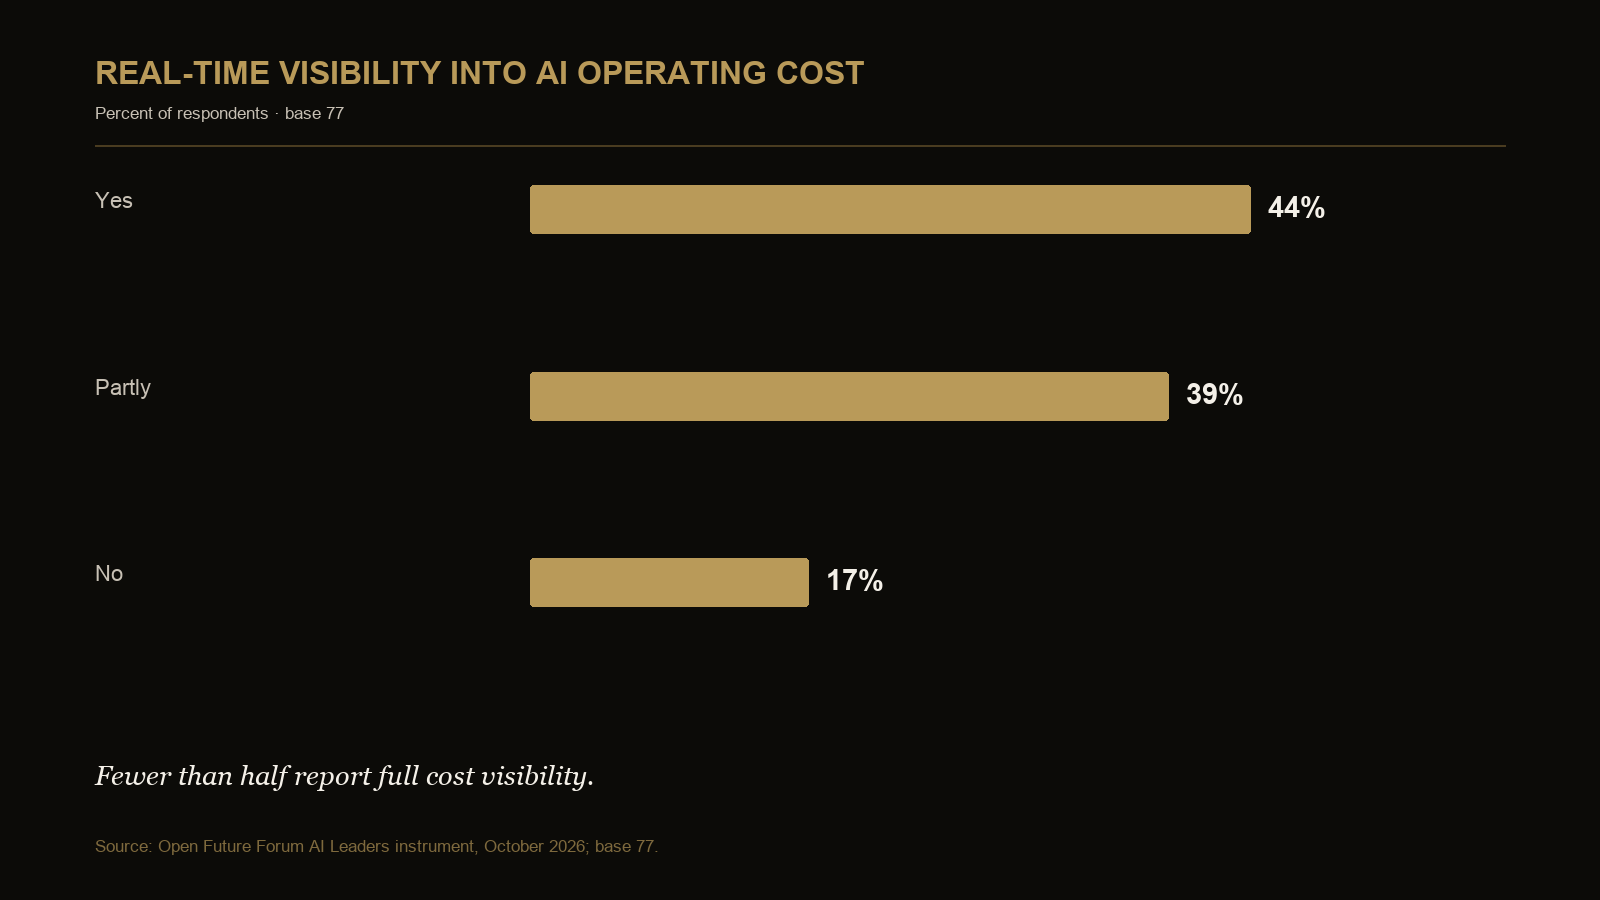
Eighty percent report production agents (base 75), but 44 percent have full real-time cost visibility (base 77). Data access and quality leads bottlenecks at 39 percent (base 75, any mention). Among applicable respondents, 37 percent use shared service accounts (base 49). These are separate operating-control indicators that a signing executive should ask about; the survey does not audit control quality or show that all conditions occur together.
An AI program can have an executive sponsor while individual agents lack clearly documented operating owners.
October CEO evidence
Three views of CEO sign-off
| Evidence lens | Base | CEO named | What it measures |
|---|---|---|---|
| Expanded common sign-off instrument | 467 | 49% (227) | How all current respondents describe AI purchase authority |
| AI Leaders sign-off cohort | 86 | 56% (48) | How a separate operating cohort describes AI purchase authority |
| CEO or founder respondent cut | 118 | 80% | How title-classified CEOs and founders answer the current common question |
All three use any mention. The role cut is recalculated from the current expanded base; it is neither a CEO-only survey nor a September carry-forward.
The first two lenses put the CEO first, while the third shows how strongly respondent seat shapes perceived ownership. The conclusion is about accountability design, not trend: a CEO signature is common, but the organization still needs explicit launch, expansion, pause and stop rights. The complete authority and cross-seat matrices belong to the Executive AI Leverage Report, with charts and counts in Executive AI Statistics.
Each lens has a distinct use. The expanded common instrument describes who appears in purchase authority across the current multi-event base. The AI Leaders cohort shows how a production-oriented event population answers the same question. The CEO-or-founder title cut shows how respondents classified into that seat attribute authority. Agreement that the CEO ranks first supports the narrow statement that CEO sign-off is common in these samples. Differences in the percentages are not evidence of movement; they reflect different cohorts and analytical cuts.
For a CEO, the practical question is what the signature authorizes. It might approve a vendor, a budget envelope, a pilot, a production workflow or an expansion into new data and actions. Those decisions carry different evidence and risk. The survey asks about purchase sign-off, so the report does not relabel its result as launch, deployment or risk-acceptance authority.
Budget and payback from the CEO or founder seat
| Measure | CEO or founder respondents (base 89) | Finance respondents (base 67) |
|---|---|---|
| Net-new funding | 39% | 43% |
| No clear AI budget | 24% | 25% |
| Software reallocation | 16% | 22% |
| Would-be headcount money | 30% | 19% |
| Payback under 6 months | 67% | 45% |
| Payback in 6 to 12 months | 26% | 36% |
| Payback in 12 to 24 months | 3% | 12% |
| Not sure about payback | 4% | 10% |
These are title-classified cuts of the current finance instrument. Funding uses any mention, and the payback export permits multi-answer combinations; shares can sum above 100 percent. They are descriptive cross-sections, not separate role surveys or month-on-month changes.
CEO and founder respondents connect AI funding with would-be headcount money more often than finance respondents and more often expect return inside six months. This does not establish that CEOs are cutting staff because of AI or that the faster expectation is achievable. It identifies two assumptions that the CEO and CFO should reconcile before expansion: what kind of benefit is being promised and which evidence will prove it.
The headcount-linked difference is 11 points, 30 percent for CEO and founder respondents versus 19 percent for finance respondents. The under-six-month payback difference is 22 points, 67 versus 45 percent. Neither difference has been tested for statistical significance, and the title classification is an analytical rule rather than a respondent-selected role. These results should prompt a joint review, not a claim that one function is more optimistic.
At that review, the CEO should ask whether the benefit is a cash reduction, avoided hiring, released capacity or commercial lift. The CFO should ask whether the baseline and cost allocation make the claim reproducible. The business owner should identify where the operating change appears. A shared definition agreed before launch is more valuable than reconciling incompatible claims after the payback deadline.
Where CEO authority meets production control
| Operating evidence from the AI Leaders cohort | Result | Base |
|---|---|---|
| Run at least one production agent | 80% | 75 |
| Have full real-time cost visibility | 44% | 77 |
| Name data access and quality as a bottleneck | 39% | 75 |
| Use shared service accounts among applicable respondents | 37% | 49 |
These rows come from separate questions in one event cohort and are not a matched CEO-level analysis.
The operating evidence does not say that CEOs personally lack visibility. It shows the information a signing executive should require: current workflow cost, named data ownership and an auditable identity for every production agent. The detailed maturity, fleet and cost analysis is in the AI Leaders AI Leverage Report.
Production adoption and cost visibility come from two questions with slightly different bases, so the 36-point difference is not a matched-respondent estimate. Data access and shared-account results answer still other questions. The defensible synthesis is that live agents create an executive information requirement spanning cost, data and identity. The survey does not establish that all four conditions occur in the same company.
External context
IBM's CEO guide to generative AI treats generative AI as an enterprise operating issue spanning data, governance, technology spending, security and finance. Open Future Forum's data shows what centralized authority cannot provide on its own: production readiness still depends on identity, cost and data controls managed below the CEO.
| Evidence source | Executive question | What this report contributes | Comparison limit |
|---|---|---|---|
| IBM CEO guide to generative AI | How should a CEO treat AI as an enterprise operating issue? | Three current views of reported CEO sign-off plus separate production-control evidence | Different methods and populations; no percentages are pooled |
| McKinsey, State of AI 2026 | What management issues accompany scaling AI? | A decision-rights model tied to first-party authority, funding and visibility measures | External context does not validate a CEO-only trend |
The external evidence supports examining AI as an operating model, while Open Future Forum adds a specific governance test: can an organization trace the CEO's authorization to named workflow owners, evidence and controls? This is an inference for management practice, not another survey result.
What this means for the CEO
Ask for an agent register, not a strategy slide. It should show the business owner, technical owner, data access, credential model, operating cost and success measure for every production agent. If the register does not exist, the organization has centralized the decision without centralizing accountability.
Decider, ratifier and delegator: an unsized governance framework
The following framework is recommended for clarifying decision rights. It was not a set of survey response options, and this research does not measure how many organizations use it.
The decider is accountable for the business decision at a defined gate: start the pilot, launch to production, expand the workflow, pause it or retire it. The decider accepts the outcome target and the evidence required for the decision. The role can change by gate, but every gate should have one named decider.
A ratifier confirms that a required condition is satisfied within a specialist domain. Finance may ratify the funding and cost evidence; security may ratify access and monitoring; legal may ratify contractual, privacy or regulatory conditions; a data owner may ratify use of a source system. Ratification is not the same as owning the business outcome, and more than one ratifier may be required.
The delegator assigns operating authority and remains accountable for the design of the chain. A CEO may delegate release authority to a technology owner, access approval to a data owner and emergency suspension to a security owner. Delegation works only when the register records the scope, evidence, expiry and escalation path. “The team owns it” is not a delegation record.
This distinction prevents the CEO from becoming the nominal owner of every technical action while preserving executive accountability for the system of decisions. It also prevents specialist approvals from being mistaken for acceptance of business value.
CEO review cadence and failure modes
At the investment gate, require the purpose, sponsor, funding route and success measure. At the production gate, require named technical, data, security and legal owners plus a tested pause path. At the expansion gate, require actual cost, outcome evidence and any open exceptions. After a material model, vendor, data or permission change, reopen the relevant gate rather than relying on the original signature.
The register should expose predictable failures: a sponsor with no workflow owner; a production system with no stop authority; a payback claim with no baseline; an agent identity with no revocation owner; an exception with no expiry; or an expansion approved without current cost evidence. The October survey does not count those failure modes. They are management tests derived from the gap between purchase authority and the separate operating evidence.
CEO decision-rights and agent register
The register should identify both the accountable role and the decision that role is allowed to make. One person can hold more than one role, but no decision right should be implied or left ownerless.
| Register field | Required entry | Primary decision right | Escalation condition |
|---|---|---|---|
| Workflow purpose and boundary | The task the agent performs and actions it may not take | Business owner approves the intended use | Scope expands beyond the approved process |
| Executive sponsor | Named executive accountable for the business decision | Approve initial funding and strategic fit | Material change in expected value, risk or reputation |
| Business owner | Named operator accountable for the outcome | Continue, expand, pause or request retirement | Outcome target missed or process owner changes |
| Technical owner | Named team accountable for reliability and change control | Approve release, rollback and technical remediation | Model, vendor, architecture or dependency changes |
| Data owner | Systems, datasets and named approver | Grant or revoke access to each data source | New sensitive data or expanded permissions |
| Agent identity | Credential type, owner, permission scope and log location | Issue, rotate, suspend and revoke credentials | Owner leaves, credential expires or anomalous use occurs |
| Financial owner | Funding route, cost center and run-cost reviewer | Approve budget, variance and expansion threshold | Cost exceeds threshold or attribution is incomplete |
| Success measure | Baseline, target, source system and review period | Accept, reject or qualify the claimed result | Measurement changes or evidence arrives late |
| Control status | Security, legal, privacy and human-review requirements | Accept controls or time-bound exceptions | Exception expires or a material incident occurs |
| Lifecycle status | Proposed, pilot, production, paused or retired | Authorize movement between stages | Stage gate lacks required evidence |
| Last decision | Decision, decision maker, evidence date and next review | Preserve an auditable record of accountability | Any material change or scheduled review |
The CEO does not need to operate every control. The CEO does need to make the chain of delegated authority visible, including who can stop the system when cost, evidence or access moves outside the approved boundary.
Implications for adjacent roles
Board directors should test whether the decision-rights model works at the workflow level, not merely whether an AI committee exists. CFOs should translate the CEO's payback expectation into a fixed baseline, full cost and evidence date. CIOs, CTOs and AI leaders should own release, reliability and change control without inheriting the business outcome by default. CISOs and data owners should have explicit authority over access, exceptions and revocation. General counsel should connect contractual and legal conditions to the same lifecycle record. People leaders should distinguish headcount planning, capacity redeployment and actual cash effects.
The shared objective is not more approval layers. It is fewer implicit handoffs.
Definitions used in this report
CEO sign-off means the CEO appears in a response to the purchase-signoff question. It does not prove exclusive authority or personal operation of the workflow.
CEO or founder respondent cut is a title-classified slice of the current instrument. It is not a CEO-only survey, and it should not be generalized to all CEOs.
Decision right is the documented authority to make a specific lifecycle decision within a defined scope. The decider, ratifier and delegator framework is recommended and unsized.
Agent register is the proposed workflow-level record connecting purpose, owners, identity, access, cost, evidence, control status and lifecycle decisions. Its existence was not measured by the instrument.
Production-agent adoption is the share reporting at least one production agent in the AI Leaders fleet question. It does not measure benefit, autonomy or control quality.
Full real-time cost visibility is a self-reported answer from a separate operating cohort, not an independently audited finance result.
Questions this report answers
What must a CEO own after approving AI?
The CEO should own the accountability design: which executive is answerable for the outcome, which operators control release and access, and which evidence permits expansion. The CEO is the most-named signer at 49 percent of common-instrument answers (base 467, any mention), but the operating decisions still need named delegates.
How should sign-off authority differ from launch and stop authority?
Sign-off authorizes the investment. Launch authority should depend on technical and control readiness; expansion authority should depend on outcome and cost evidence; pause and stop authority should be explicit before production. In the separate AI Leaders cohort, the CEO appears in 56 percent of sign-off answers (base 86, any mention).
Why does a CEO need an agent register?
Production-agent adoption exceeds full real-time cost visibility by 36 percentage points across two questions from the same event (bases 75 and 77). A register connects each agent to an owner, identity, cost, data boundary, success measure and lifecycle decision so executive sponsorship is not mistaken for operating control.
Does this edition measure a new CEO-only trend?
No. No new CEO-only instrument was fielded for October. The report recalculates CEO and founder title-classified cuts from the expanded current common and finance instruments and reports AI Leaders operating evidence as a separate cohort. Neither is a month-on-month CEO trend.
Should the CEO personally approve every production change?
No. The CEO should make the decision architecture explicit. Technical, data, security, legal and business owners can hold bounded rights, while material changes and exceptions escalate according to the register. The decider, ratifier and delegator model is a recommended framework, not a measured adoption result.
What should make an AI decision return to the CEO?
A material change in strategic purpose, expected value, cost, reputation, risk tier or action boundary should trigger escalation under the organization's documented rules. The survey does not prescribe a universal threshold; each company should define and record its own.
Do the CEO and finance seat differences prove an optimism gap?
No. CEO and founder respondents more often select under-six-month payback and headcount-linked funding than finance respondents, but the cuts are descriptive, untested for causal explanation and drawn from title classification. They identify a conversation about assumptions, not a scored “gap.”
Key citable facts
- The CEO appears in 49 percent of AI sign-off answers across Open Future Forum's October common instrument (base 467, any mention).
- In the Enterprise AI at Microsoft cohort, the CEO appears in 56 percent of sign-off answers (base 86, any mention).
- Eighty percent report production agents (base 75), while 44 percent report full real-time AI cost visibility (base 77).
Methodology and honesty notes
No new CEO-only instrument was fielded for October. CEO and founder role cuts were recalculated from the expanded current common and finance instruments using respondent-title classification; they are not September values carried forward and do not establish month-on-month movement. AI Leaders operating measures come from a separate cohort and are not CEO-level results. Respondents are deduplicated per question by email; invited-only rows are excluded. Multi-select questions use any mention.
Related reading
- Executive AI Leverage Report
- Board Director AI Governance Report
- Executive AI Statistics
- Who Signs Off on AI Purchases in 2026?
Citation and editions
Suggested citation: Newlands, M. (2026). CEO AI Leverage Report, Edition 4. Open Future Forum, October 2026. This edition supersedes Edition 3, September 2026.
Work These Questions with CEO Peers
The CEO Executive Forum meets through small, off-the-record gatherings. Membership is by application and referral.