The founder baseline
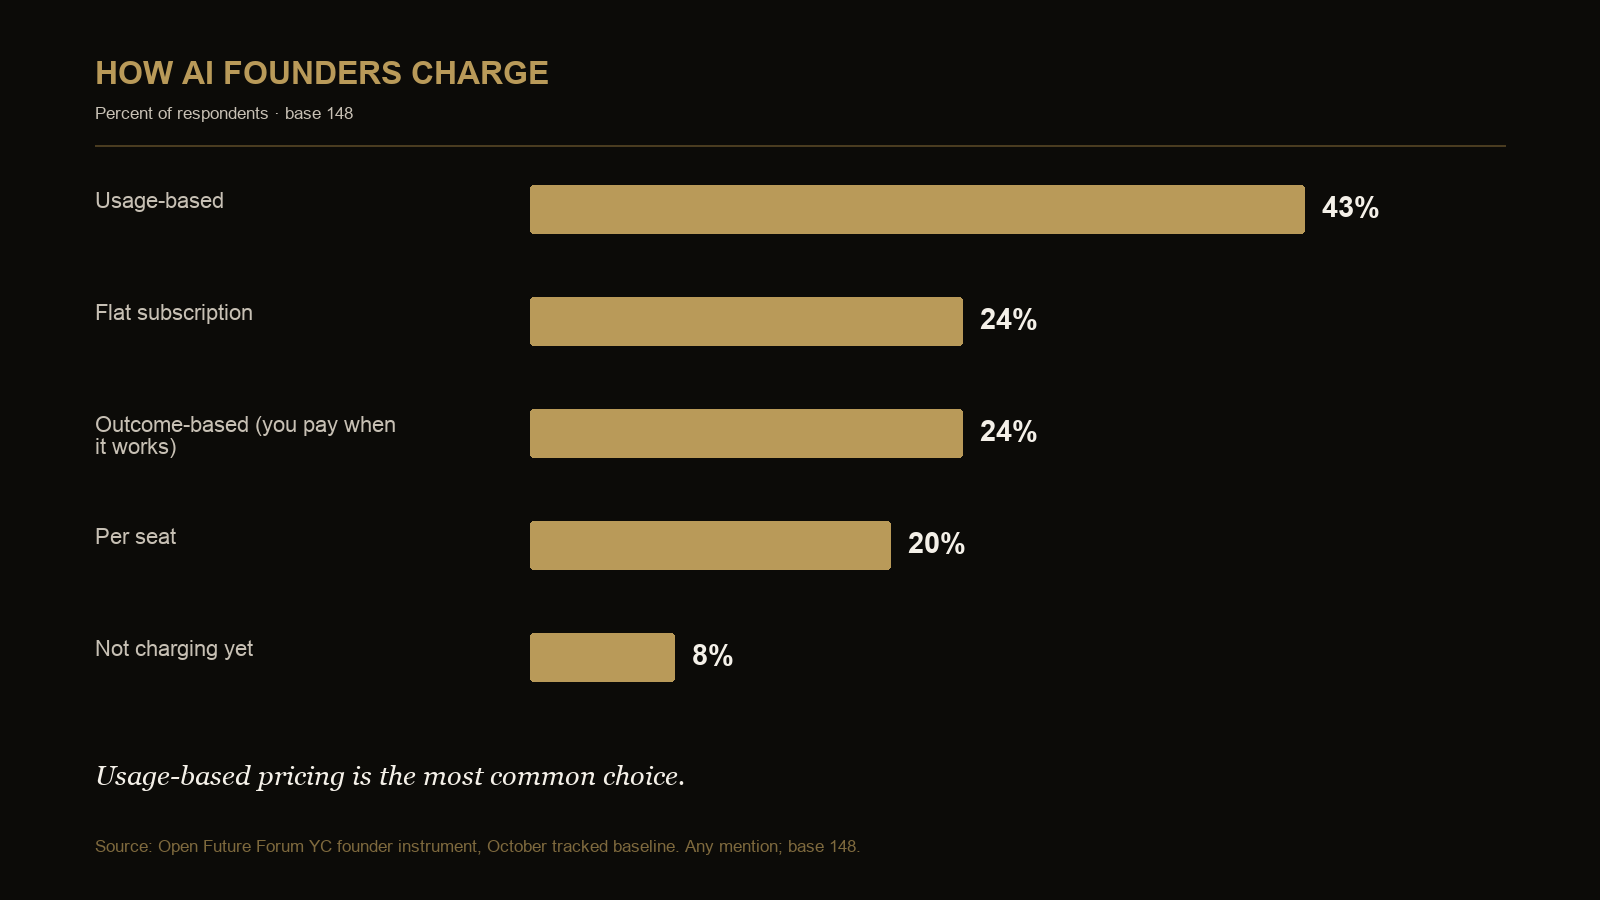
- Usage-based pricing is named by 43 percent, flat subscription by 24 percent, outcome pricing by 24 percent, per-seat pricing by 20 percent and not charging yet by 8 percent (base 148, any mention).
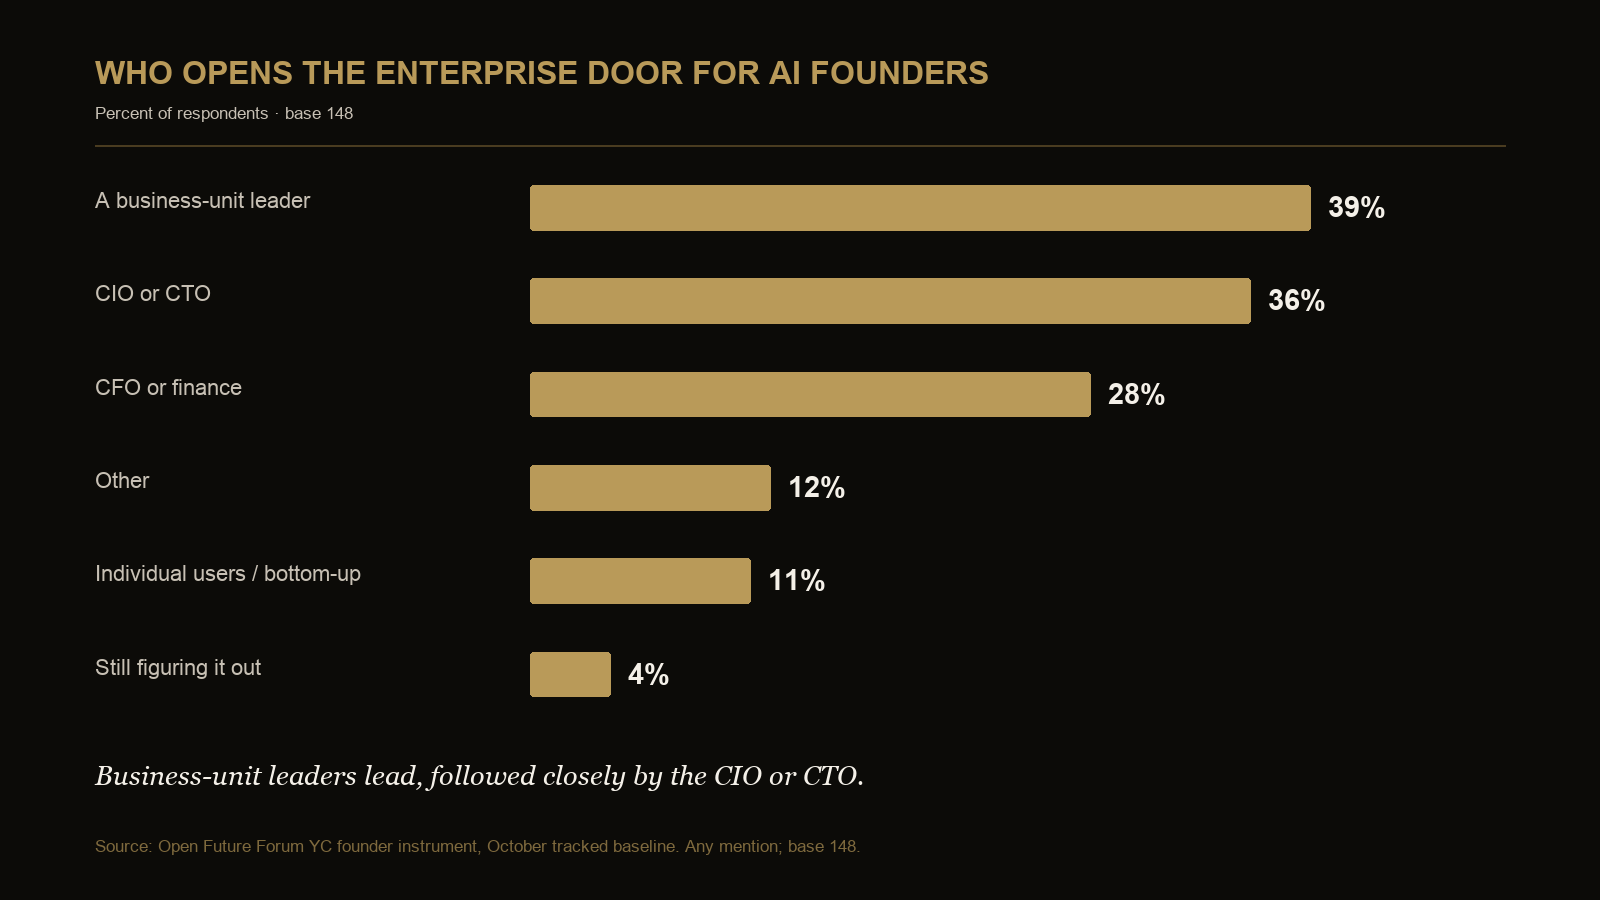
- A business-unit leader is the most-named enterprise buying doorway at 39 percent, followed by the CIO or CTO at 36 percent and finance at 28 percent (base 148, any mention).
- In a separate buyer-side common instrument, the CEO appears in 49 percent of AI purchase sign-off answers (base 467, any mention).
These findings describe pricing components and buying roles, not one universal go-to-market motion. Both founder questions allow multiple selections, and the buyer-side sign-off result comes from a different respondent population.
What changed since Edition 2
The evidence base did not change for pricing or the buying doorway. Edition 3 changes the use of the evidence: it turns the two baselines into a pricing-and-buying-path worksheet that founders can use to test whether the commercial model, sales path and margin evidence fit together.
Evidence provenance and definitions
The pricing and doorway answers come from the same 148 deduplicated respondents to the latest comparable YC founder instrument. Both questions allow multiple selections, so a company can use usage plus subscription pricing and can name both technology and a business-unit leader as entry routes. The October operator evidence used later in this report comes from the separate AI Leaders instrument. It is included to define the production gate buyers may apply, not to suggest that the founder respondents encountered those exact bottlenecks.
| Term | Meaning in this report | What it does not mean |
|---|---|---|
| Pricing component | Any model selected by the founder: usage, flat subscription, outcome, seat or not charging | One mutually exclusive company category |
| Buying doorway | A role or route selected as the way into an enterprise purchase | The final signer, budget owner or a matched stage in one buyer's funnel |
| Buyer-side sign-off | The role named in a separate common instrument as signing AI purchases | The role that approved the specific founder respondent's product |
| Production gate | The evidence a buyer may require before moving an AI product into a material live workflow | A claim that every buyer uses the same process or threshold |
| Matched founder cut | The 148 respondents who answered both pricing and doorway questions | Evidence that a doorway caused a pricing choice or that every named doorway was pursued |
No new founder pricing or doorway instrument was fielded for October. “October report” identifies the publication edition; it does not turn the retained baseline into a month-on-month observation.
Pricing: how founders charge
| Pricing model | Count | Share |
|---|---|---|
| Usage-based | 63 | 43% |
| Flat subscription | 36 | 24% |
| Outcome-based | 35 | 24% |
| Per seat | 29 | 20% |
| Not charging yet | 12 | 8% |
Base 148; any mention, so shares can sum above 100 percent.
Usage pricing appears in 63 of 148 answers. Flat subscription and outcome pricing are nearly level at 36 and 35, while per-seat pricing appears in 29. These are components that can coexist in one commercial model; the table should not be read as 148 mutually exclusive company archetypes.
Pricing by identifiable YC batch era
| YC batch classification | Base | Usage | Subscription | Outcome | Per seat | Not charging |
|---|---|---|---|---|---|---|
| YC 2024 to 2026 | 53 | 51% | 26% | 21% | 17% | 9% |
| Unclassified | 83 | 36% | 22% | 25% | 23% | 8% |
Any mention. Fifty-three respondents supplied a batch classified as 2024–2026, and 83 could not be classified from the supplied field. Twelve respondents fall into earlier batch eras; those groups are omitted because each is below the table's display floor.
Among respondents identifiable as YC 2024–2026, usage pricing is named by 51 percent. The large unclassified group and small earlier-era groups mean the data does not support a claim that pricing changed by founder generation or over time.
Buying path: who opens the door
| Enterprise buying doorway | Count | Share |
|---|---|---|
| Business-unit leader | 58 | 39% |
| CIO or CTO | 53 | 36% |
| CFO or finance | 41 | 28% |
| Other | 18 | 12% |
| Individual users or bottom-up | 16 | 11% |
| Still figuring it out | 6 | 4% |
Base 148; any mention, so shares can sum above 100 percent.
The founder view is led by business-unit and technology executives. The separate buyer-side instrument names the CEO most often at final sign-off. The two questions measure different moments with different populations, so they do not form a matched funnel. They do, however, warn founders not to assume that the first sponsor is the final signer.
Pricing and doorway together: a matched founder view
Because the two founder questions were answered by the same 148 people, pricing can be viewed within the most-named doorway groups. Each doorway column overlaps with other doorway columns, and each pricing answer can overlap with other pricing answers.
| Named enterprise doorway | Doorway base | Usage | Subscription | Outcome | Per seat | Not charging |
|---|---|---|---|---|---|---|
| Business-unit leader | 58 | 47% | 26% | 29% | 19% | 5% |
| CIO or CTO | 53 | 43% | 21% | 38% | 25% | 0% |
| CFO or finance | 41 | 46% | 29% | 27% | 22% | 0% |
Respondents answering both multi-select questions; base 148. Doorway columns use any mention and overlap. Percentages are rounded from counts in the matched table.
Usage is the most-named component in each of the three displayed doorway groups. Outcome pricing appears in 38 percent of CIO or CTO doorway answers, compared with 29 percent of business-unit and 27 percent of finance doorway answers. These are descriptive associations. The table does not show that a technical doorway causes outcome pricing, that a founder used the pricing component with the named role, or that one combination closes faster.
The supported commercial use is as a hypothesis generator. A founder entering through technology can test whether the buyer expects reliability or technical performance to define an outcome. A founder entering through finance can test whether usage maps cleanly to a cost or value ledger. A business-unit entry can test whether the pricing unit follows the operational workflow. The answers must still come from customer discovery and deal evidence.
Pricing-and-buying-path worksheet
Complete this worksheet for one target workflow rather than for the company in the abstract. It is a commercial planning tool derived from the research, not another survey result.
| Decision | Founder entry | Evidence to capture before advancing |
|---|---|---|
| Workflow | Name the specific job the product performs | Current process, baseline cost or outcome and responsible operator |
| Entry sponsor | Business-unit, technology, finance or bottom-up user | Sponsor's authority, urgency and success measure |
| Technical gate | Data, integration, security and reliability review | Required systems, data scope, identity method and acceptance test |
| Economic buyer | Person who owns the budget or financial case | Budget source, approval band and cost-center owner |
| Final signer | Executive or committee that can authorize the purchase | Approval criteria, required evidence and meeting date |
| Pricing unit | Usage, subscription, outcome, seat or combination | Exact billable unit and how the customer can verify it |
| Cost driver | Model, inference, data, support or infrastructure cost | Unit cost at current and expected volume |
| Margin guardrail | Company-approved gross-margin threshold | Price or architecture action if the threshold is missed |
| Outcome proof | Measure tied to the sponsor's workflow | Baseline, current result, attribution method and review cadence |
| Renewal proof | Evidence required to continue or expand | Usage, outcome, reliability and control record the customer will see |
The worksheet makes two possible mismatches visible. First, the role that wants the product may not control the budget or signature. Second, the unit that is easiest to price may not be the unit the buyer can audit or the founder can deliver at an acceptable margin.
Gross-margin questions before choosing a pricing model
Can the billable unit be measured by both sides?
Usage pricing is easier to defend when the vendor and customer can reconcile the same unit. Define whether the unit is a request, task, token, workflow completion or another observable event before it appears in a contract.
Does the price move with the main cost driver?
A pricing unit can grow while gross margin deteriorates if the underlying model, inference, data or support cost grows faster. Test the relationship at current volume and at the volume assumed in the sales case.
Is an outcome attributable enough to price?
Outcome pricing requires an agreed baseline, a defined measurement window and a rule for factors outside the product's control. If the customer cannot audit the result, the commercial dispute may be larger than the pricing advantage.
What evidence reaches the final signer?
The entry sponsor's product enthusiasm may not answer finance, technology or executive approval questions. Prepare a short evidence packet covering workflow value, unit economics, security and implementation responsibility.
The enterprise production gate
The current AI Leaders instrument supplies a buyer-side context that did not exist in the founder baseline. It is a separate respondent population and must not be used as if it measured founder customers. It does, however, identify the issues a production evidence packet should be prepared to address.
In the separate AI Leaders instrument, data access and quality is the most-named production bottleneck at 39 percent (29 of 75, any mention). Compute, integration and inference cost form a second group, while governance, identity and talent remain present. These figures describe an operator sample, not the founder cohort. A founder can have the right entry sponsor and a plausible commercial model yet stall because the production evidence does not answer one of these operating questions. The complete distribution and question limits appear in the AI Leaders AI Leverage Report.
A founder's production-gate packet
| Gate | Evidence the vendor should be ready to provide | Buyer question it answers |
|---|---|---|
| Data | Required sources, data classes, quality assumptions and handling boundaries | What must the product reach, and what fails when the data is incomplete? |
| Integration | Systems touched, APIs, change ownership, test plan and rollback | How does this enter the workflow without creating an unmanaged dependency? |
| Economics | Billable unit, expected volume, infrastructure assumptions and exception cost | What will the workflow cost at current and scaled use? |
| Identity and security | Agent identity, permission scope, logging, human attribution and revocation | Can actions be bounded, reviewed and stopped? |
| Performance | Baseline, acceptance criteria, reliability, exception and outcome measures | What evidence determines whether the deployment is successful? |
| Ownership | Business sponsor, technical owner, budget owner and final signer | Who makes each decision from pilot through production? |
The packet should be deal-specific. A generic security document or ROI slide may be useful background, but it cannot substitute for the workflow, systems, data and economics the buyer is actually approving.
After contract signature, maintain the approved claims, tests, owners and rollback evidence through the enterprise evidence room and 30-day handoff.
Commercial failure modes to test before scaling
The pricing meter cannot be reconciled
If the vendor counts one unit and the customer observes another, usage disputes and forecast error are likely. Define the system of record, timing, rounding, retries, failed work and customer access to the meter before volume grows.
The sponsor has urgency but not authority
A business-unit or technology doorway can create a strong evaluation without controlling budget, security approval or signature. Map those decisions explicitly and learn which evidence each owner requires; do not interpret product engagement as final approval.
Outcome pricing absorbs factors outside the product
An outcome can depend on customer data, staffing, process adherence or market conditions. Define the baseline, measurement window, exclusions and dispute path. Otherwise, the product may create value while the contracted outcome remains impossible to attribute.
Revenue scales faster than delivery efficiency
Usage growth can increase inference, support, integration and human-review cost. Track gross margin at the billable unit and customer cohort level, including exceptional work that sits outside the product ledger.
A pilot passes without a production owner
A successful technical test can stall when no executive accepts the workflow, budget or operational risk. The pilot exit criteria should name the production business owner, technical owner, economic buyer and final signer before the evaluation begins.
Implications across the buying system
For enterprise buyers
Ask the vendor to define the billable unit and the operating unit in the same conversation. If price is per task but cost, quality and risk are reviewed per workflow, specify how the two reconcile. Keep the entry sponsor's benefit claim separate from the final approval record.
For procurement teams
Convert pricing language into auditable contract mechanics: measurement source, included volume, overage, model or infrastructure changes, disputed usage, service failure, outcome attribution and exit data. Procurement should also record which cost drivers the vendor can change and what notice or adjustment rights follow.
For investors
Test whether the commercial model remains attractive after production friction is included. Pipeline and contracted recurring revenue can look strong while integration, inference, review or support requirements compress margin. Ask for cohort-level evidence linking pricing unit, customer usage, delivery cost, time to production and expansion or renewal.
External context matrix
| External source | Relevant context | What this report adds | Boundary |
|---|---|---|---|
| McKinsey, State of AI 2026 | Broader evidence on AI scaling, costs and uneven enterprise-level financial impact | A founder pricing-and-doorway baseline plus a separate operator bottleneck distribution | Different samples and wording; figures should not be combined |
| IBM, Cost of a Data Breach 2026 | Context on agent identity, access and auditability | A practical identity-and-security gate founders can attach to the production packet | This report does not measure breach outcomes or certify a control environment |
The sources provide context only. Their publishers are not affiliated with this report and do not endorse it.
What this means for founders
Build the sale as a path, not a persona. Identify who experiences the problem, who evaluates the system, who owns the budget and who signs. Then connect the pricing unit to both customer evidence and your own gross-margin record. A clever pricing model does not compensate for an unmeasurable unit or an unidentified approver.
Questions this report answers
Which AI pricing model appears most often in the founder baseline?
Usage-based pricing leads at 43 percent (63 of 148, any mention).
Who is the most common enterprise buying doorway?
Business-unit leaders lead at 39 percent, followed by CIOs or CTOs at 36 percent and finance at 28 percent (base 148, any mention).
Is the doorway usually the final signer?
The data cannot establish that relationship because the founder doorway and buyer-side sign-off questions come from separate populations. The separate buyer-side instrument names the CEO most often at sign-off, which supports mapping entry, evaluation and approval as distinct steps.
Does this edition show a change in founder pricing?
No. No October event repeated the relevant founder questions, so the figures are carried forward from the latest comparable baseline.
What evidence should support usage or outcome pricing?
Founders should define the billable unit, reconcile it with the main cost driver, document the gross-margin guardrail and give the buyer an auditable baseline and result.
Does the matched pricing-by-doorway table prove a winning combination?
No. Pricing and doorway answers overlap, and the table is descriptive. It can identify combinations to test, but it does not measure conversion, contract use, sales velocity or causation.
Why does this founder report include AI Leaders bottleneck evidence?
It defines a current enterprise production gate using a separate operator instrument. The full chart remains in the AI Leaders report; this summary is not evidence about the founder cohort or a claim that every founder customer experienced the listed bottlenecks.
Key citable facts
- Usage-based pricing is named by 43 percent of founders in the latest comparable baseline (63 of 148, any mention).
- Business-unit leaders are the most-named enterprise buying doorway at 39 percent, followed by CIOs or CTOs at 36 percent and finance at 28 percent (base 148, any mention).
- The founder pricing and doorway figures are carried forward and do not measure October movement.
Methodology and honesty notes
Founder pricing and buying-doorway figures are retained from the latest comparable instrument because no October event repeated those questions. Respondents are deduplicated by email for each question, with the latest answer retained. Both founder questions are multi-select and use the any-mention convention.
The matched pricing-by-doorway table contains the same 148 respondents who answered both founder questions. Doorway columns overlap because a respondent could name more than one route, and pricing answers also overlap. The table is descriptive and does not measure conversion or causality. The production-bottleneck summary comes from a separate AI Leaders instrument with a base of 75; it is included as current buyer-side context and is not attributed to the founder cohort.
The buyer-side CEO sign-off figure comes from a separate common instrument and does not create a matched sales funnel with the founder answers. Batch classification is based on the supplied field; 83 of 148 respondents could not be classified, and earlier-era groups are below the display floor. The report is independent and is not affiliated with or endorsed by Y Combinator.
Related reading
- VC and CVC AI Investment Report: investment thesis, reported impact and investor seniority
- Investment Banking AI Report: usage, revenue quality and gross-margin diligence
- Executive AI Statistics: source tables, bases and methodology
- How Do AI Startups Price Their Products in 2026?
Citation and editions
Suggested citation: Newlands, M. (2026). YC Founder AI Report, Edition 3. Open Future Forum, October 2026. This edition supersedes Edition 2, September 2026.
Work These Questions with Founder Peers
Forum Select meets through small, off-the-record gatherings. Membership is by application and referral.