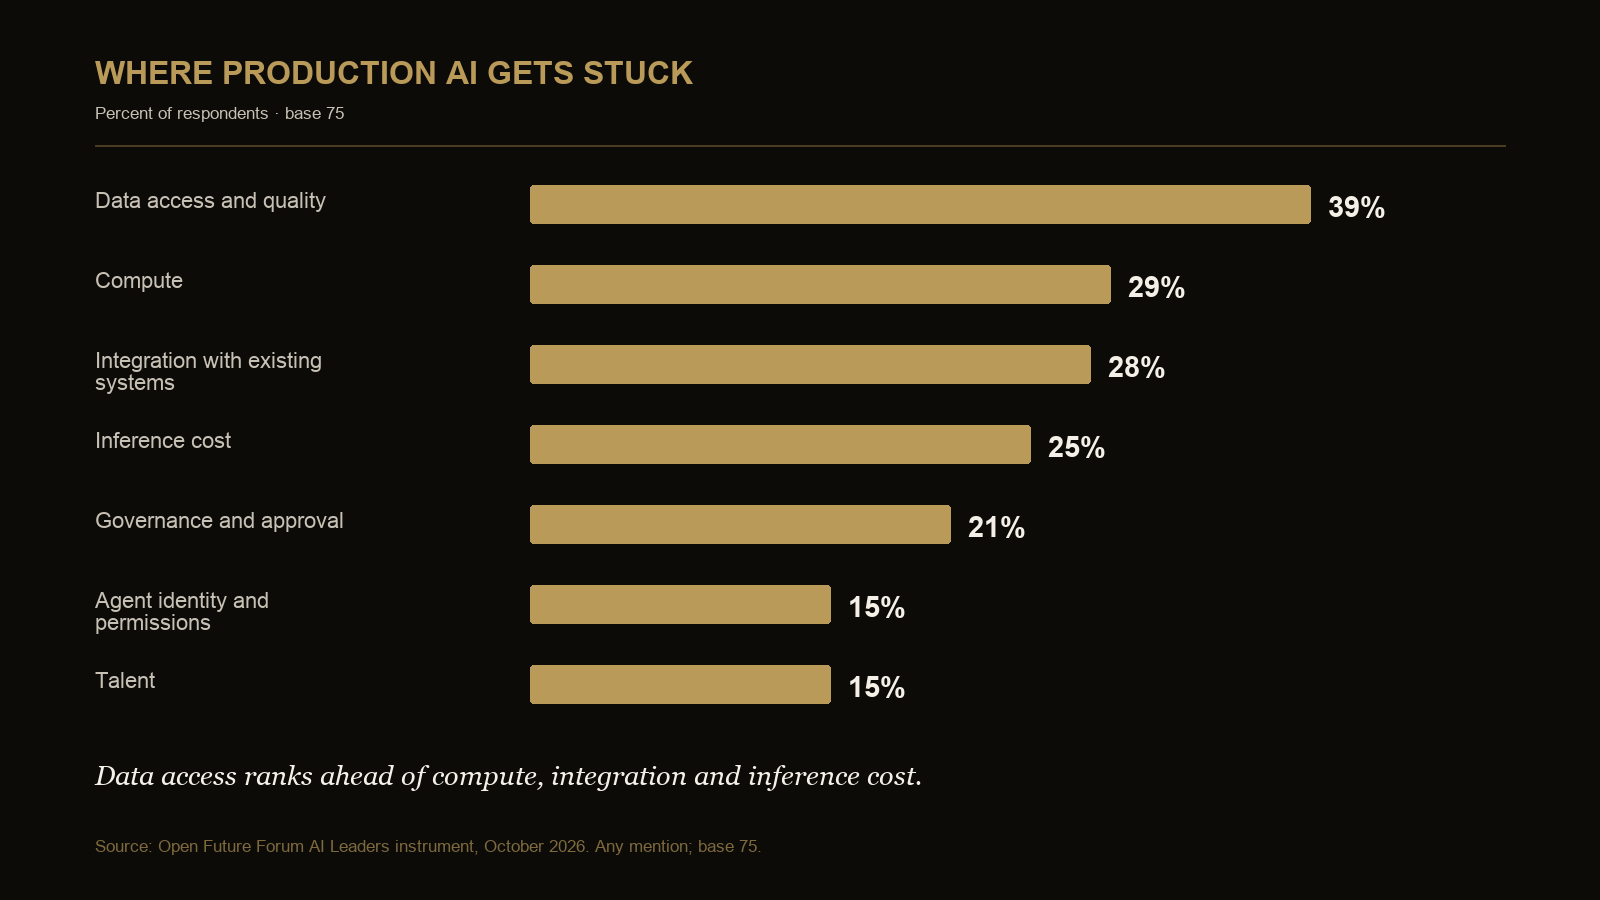
Data access and quality is the most-named production bottleneck at 39 percent, followed by compute at 29 percent, integration with existing systems at 28 percent and inference cost at 25 percent (base 75, any mention). Governance and approval, agent identity and permissions, and talent each trail further behind.
Respondents could select more than one bottleneck, and the spread across the list is the finding: data, infrastructure, cost, governance and identity all draw meaningful shares, so the production problem is not reducible to model choice alone.
| Production bottleneck | Count | Share |
|---|---|---|
| Data access and quality | 29 | 39% |
| Compute | 22 | 29% |
| Integration with existing systems | 21 | 28% |
| Inference cost | 19 | 25% |
| Governance and approval | 16 | 21% |
| Agent identity and permissions | 11 | 15% |
| Talent | 11 | 15% |
What this does not prove: because respondents could select more than one answer, shares do not sum to 100 percent; the question does not establish severity, duration, or whether a named bottleneck actually caused a delay or failure.
Full data, bases, and methodology: AI Leaders AI Leverage Report, October 2026 and AI Transformation Report, October 2026.
The executives behind these numbers compare notes at Open Future Forum's role-specific peer groups. Inquire about membership.