The September answer: who owns AI buying, and what has it cost them?
Two things moved inside August, and one did not. Authority kept consolidating: the CEO’s share of sign-off mentions rose, the CFO’s rose faster, and the business unit nearly vanished as a signer. The proof window tightened: the share of finance-lane respondents naming ROI as the blocker jumped twelve points, while the share expecting payback inside six months fell seven. And budget clarity did not improve: a quarter of respondents still have no clear AI budget, and a quarter are funding AI with money they would have spent on people. The market is more certain about who decides, less certain about how it pays back, and no clearer about where the money comes from.
The August read comes from one room, CFOs on the Bay, and 54 people. It is directional. What makes it worth publishing is that it points the same way as the cumulative base of 290, only harder.
What changed since Edition 2, room by room
Edition 2 compared two July cohorts. Edition 3 compares everyone who applied through 30 July with everyone who applied after it, room by room. Same instruments, same events program, later crowd; different people, not a panel.
| Room | Line | Through July | August cohort | Change |
|---|---|---|---|---|
| Finance | CEO named as signer | 46 percent (238) | 50 percent (54) | +4 |
| Finance | CFO or finance named | 33 percent | 43 percent | +10 |
| Finance | Individual business unit | 12 percent | 4 percent | -8 |
| Finance | No single owner yet | 12 percent | 7 percent | -5 |
| Finance | Proving ROI as the blocker | 53 percent | 65 percent | +12 |
| Finance | Payback under six months | 55 percent | 48 percent | -7 |
| Finance | No clear AI budget | 29 percent | 26 percent | -3 |
| Finance | Headcount money | 20 percent | 24 percent | +4 |
| Security | Agent access as top problem | 60 percent (53) | 75 percent (61) | +15 |
| Security | Data leaking into AI models | 21 percent | 38 percent | +17 |
| Security | Shadow AI | 30 percent | 21 percent | -9 |
| Security | Dedicated AI security budget line | 32 percent | 41 percent | +9 |
| Security | No AI security spend | 13 percent | 8 percent | -5 |
| Marketing | AI does the work of more people | 41 percent (34, directional) | 50 percent (127) | +9 |
| Marketing | Creating content faster | 68 percent | 43 percent | -25 |
| Marketing | Nothing measurable yet | 6 percent | 11 percent | +5 |
| Marketing | Past exploring agents | 81 percent (230) | no new data | |
| Founders | Usage-based pricing | 43 percent (148) | no new data | |
| Investors | CEO owns portfolio AI buying | 51 percent (245) | no new data |
Source: Open Future Forum, Executive AI Leverage Report, Edition 3, September 2026.
Any-mention convention. Single-digit moves are noise; the five double-digit moves are the story, and four of them point the same way: the CFO claiming the signature, proof being demanded, agent access rising as the security problem, and data leakage overtaking shadow AI. The fifth, content speed falling 25 points in marketing, is partly the room broadening from content teams to measurement leaders and partly the function’s value moving from output to people.
Finance. The sign-off line moved toward the money: CFO 33 to 43, business unit 12 to 4, no single owner 12 to 7. Proving ROI rose twelve points; payback inside six months fell seven. The funding mix barely moved. Full data: CFO AI Leverage Report, Edition 3.
Security. On 61 new responses, agent access rose 15 points and data leakage 17, shadow AI fell 9. Dedicated budget lines rose nine points; no-spend fell five. The problem and the money both rose, and the gap did not close. Full data: CISO AI Leverage Report, Edition 3.
Marketing and growth. No new agentic-status data; 81 percent past exploration stands. The new impact line produced a three-way tie. Full data: CMO AI Leverage Report, Edition 3.
Founders and investors. No instrumented gathering in August for either. Lines carried forward and labeled. Full data: the September refresh and note.
What stayed the same: the CEO as the most-named signer from every vantage point, net-new money as the largest funding source, proving ROI as the top blocker, agent access as the top security problem, agents as the subject of every open-text field.
What surprised us: authority consolidated without the budget consolidating with it. The CFO took ten points of the signature in a month and the share with no clear AI budget barely moved. In Edition 2 we expected the pen and the line item to travel together. August says the pen arrives first.
Where this research comes from
The Executive AI Leverage Report is the synthesis edition of the Enterprise AI Buying and Budget Index, built from instrument questions embedded in the application flow for Open Future Forum events across every executive seat: the finance rooms convened with the CFO Executive Forum, the CISO Roundtable Dinners convened with the CISO Executive Forum, the marketing and growth panels convened with the CMO Executive Forum, the AI Leaders events, the CEO Private Dinners, the YC founder gatherings, and the investor drinks. Each role edition reads one lane; this edition reads them against each other. Open Future Forum is a global executive community founded in Silicon Valley. Its network reaches tens of thousands of executives and investors worldwide. It runs a year-round calendar of events for senior executives and investors through Forum Select, its invite-only private gatherings, and Forum Events, its open panels and gatherings, and publishes original research built on first-party survey and qualitative data from its executive network.
What did not move, and why
Three lines are paused this edition because no form carried the question in August: agentic status (marketing), founder pricing and buyer owner, and every investor line. Their cumulative figures are carried forward and labeled. Two lines do not exist yet: the four-stage maturity question behind the AI Transformation Index, and any dollar figure. Both are on the October forms. The AI Transformation Report, Edition 2, is a proxy built from the three-stage deployment question and agentic status, and says so.
The thesis, in one line
Authority is consolidating faster than accountability, and the finance seat has begun to claim the signature that the CEO seat says it holds.
Who owns the AI buying decision? The triangulation
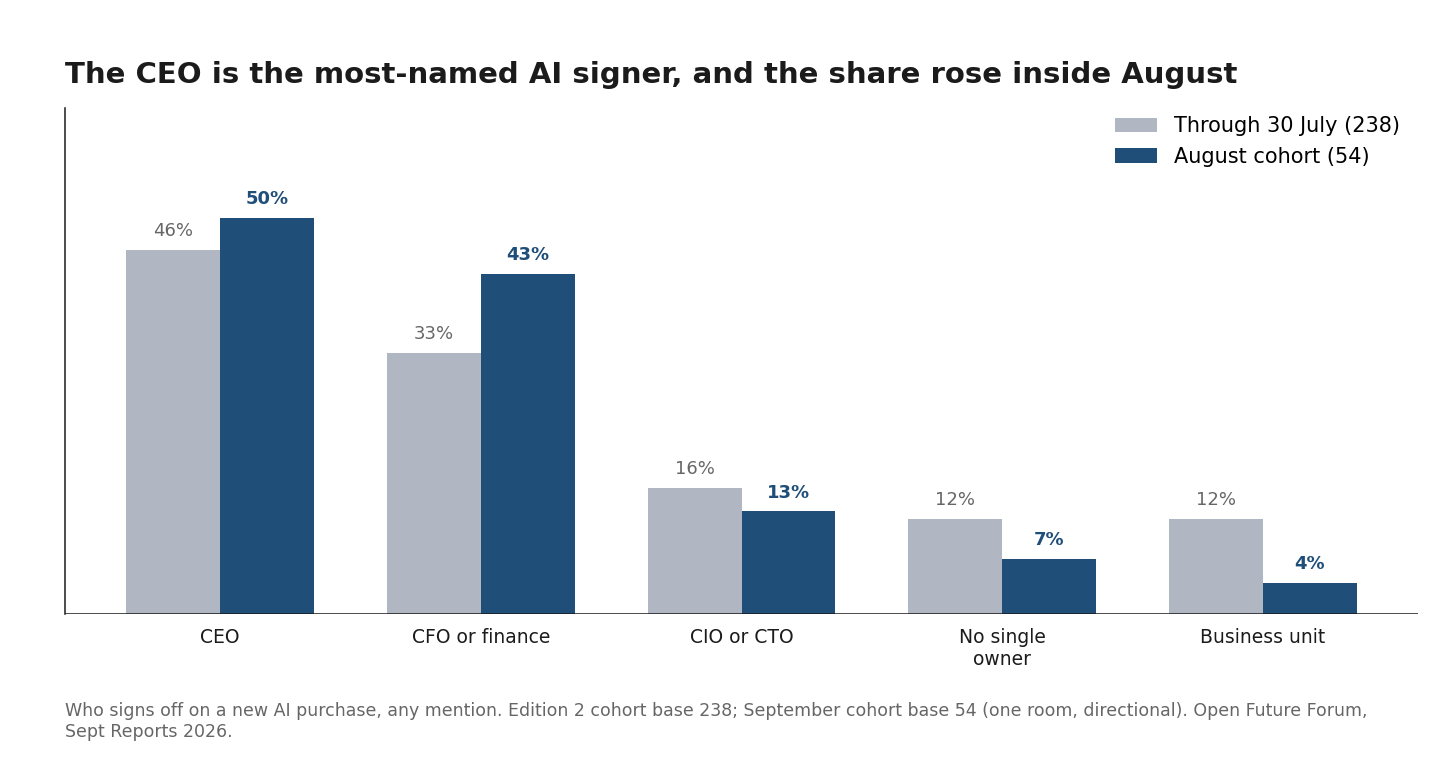
Who owns the AI buying decision?
| Vantage point | Instrument | CEO share | Base |
|---|---|---|---|
| Operators (finance rooms) | Who signs off on a new AI purchase? | 47 percent (August cohort 50) | 290 (54) |
| Investors (across portfolios) | Who increasingly owns the AI buying decision? | 51 percent | 245 |
| Founders (selling in) | Who owns the buying decision inside your customer? | No CEO option; the answer splits three ways: business-unit leader 39 percent, CIO or CTO 36, CFO or finance 28 | 148 |
Source: Open Future Forum, Executive AI Leverage Report, Edition 3, September 2026.
Different populations, different question wordings, one direction from two of them. The third, the sellers, cannot see the CEO because the instrument does not offer the seat; what they report is the doorway they enter, not the signature at the end. That mismatch is the Seat Split, defined below, and it is the most useful thing this edition can tell a founder.
Leverage by seat: the data read per C-level
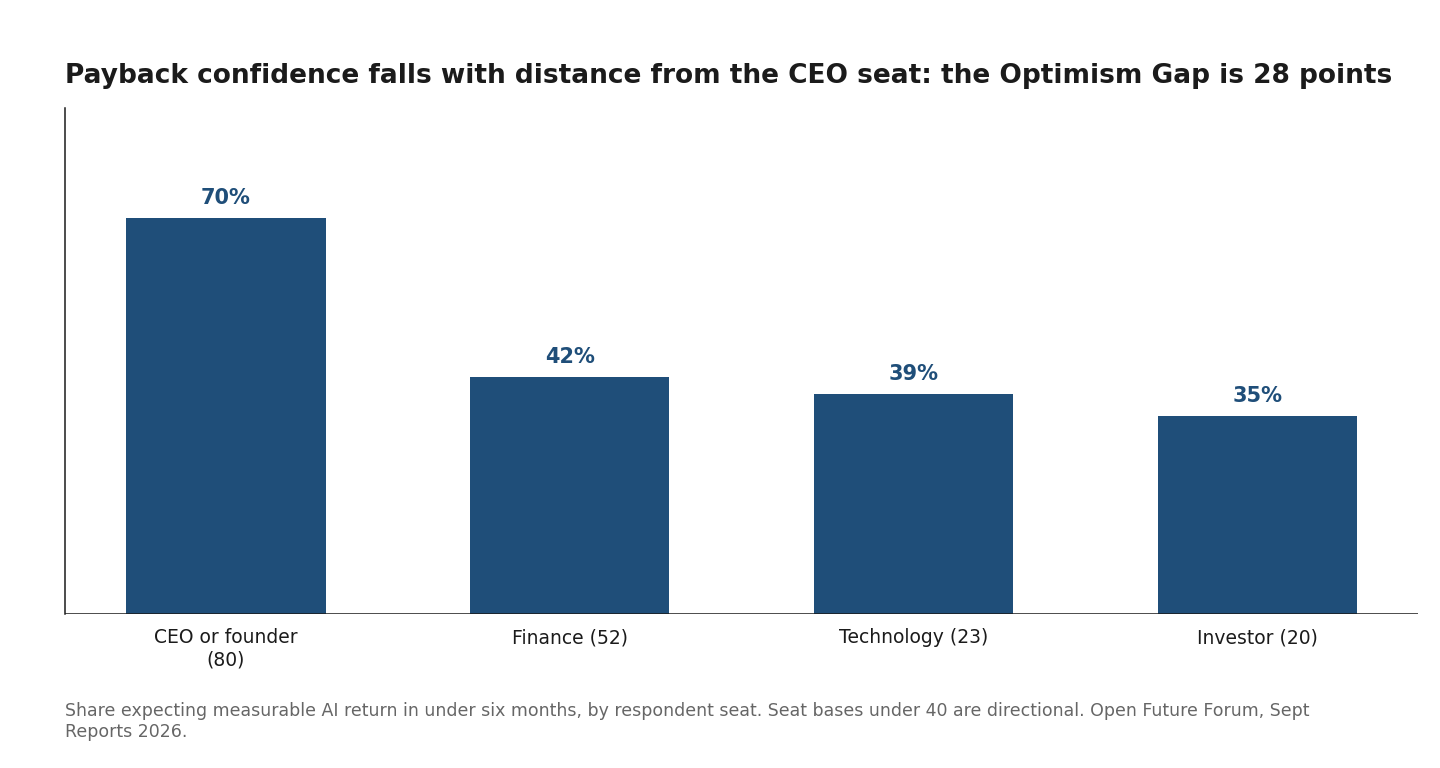
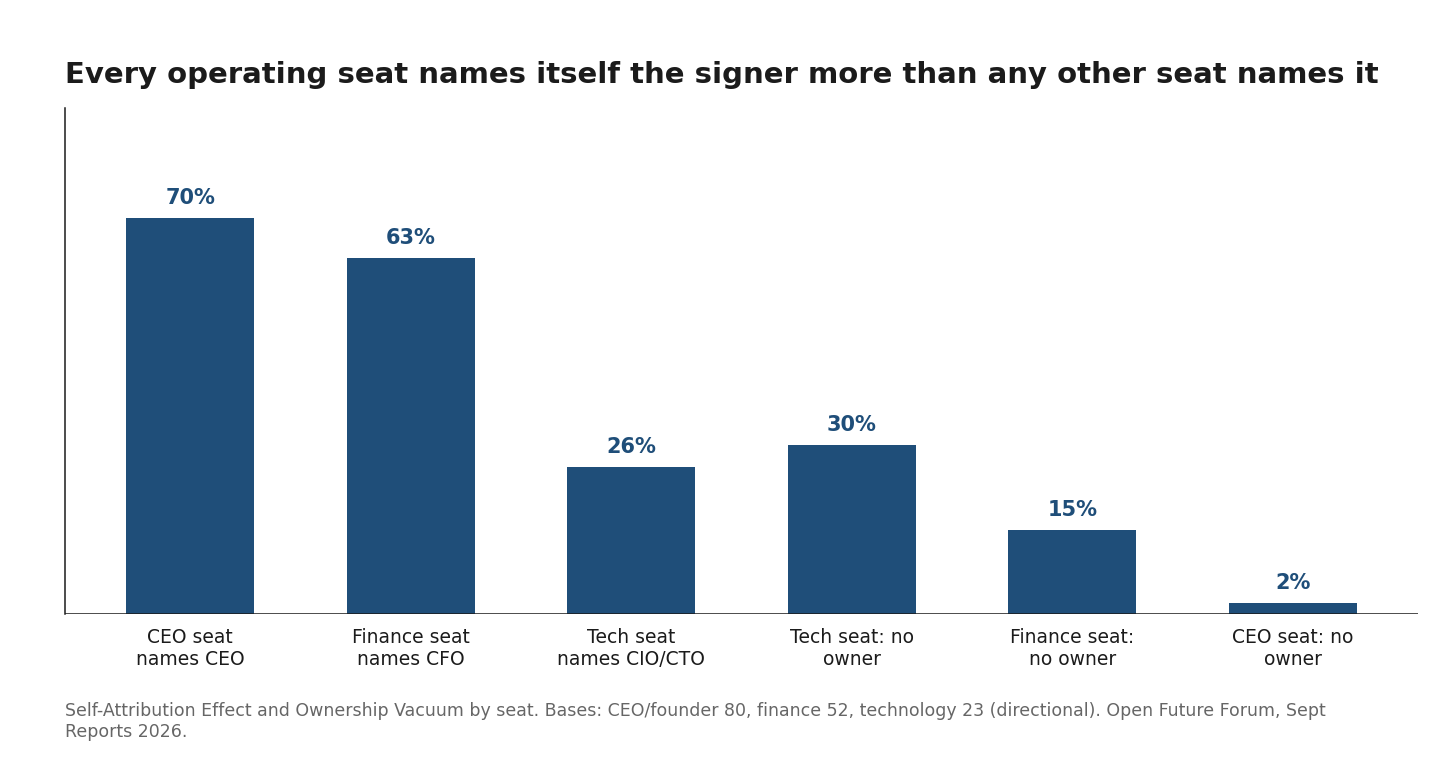
The instrument questions cut by the respondent’s own chair, via job-title classification. Seat bases: CEO and founder 80 (clears the floor), finance 52 (clears), technology 23 and investor 20 (directional). A further 53 respondents gave no title and 59 could not be classified; they are excluded from this table and reported in the methodology.
| The same questions, four chairs | CEO/Founder (80) | Finance (52) | Technology (23) | Investor (20) |
|---|---|---|---|---|
| Says the CEO signs AI purchases | 70 percent | 31 percent | 26 percent | 35 percent |
| Says their own seat signs | 70 percent | 63 percent | 26 percent | n/a |
| Says no single owner signs yet | 2 percent | 15 percent | 30 percent | 20 percent |
| Expects AI payback under six months | 70 percent | 42 percent | 39 percent | 35 percent |
| Funds AI from would-be headcount money | 34 percent | 19 percent | 22 percent | 10 percent |
| Has no clear AI budget yet | 19 percent | 25 percent | 26 percent | 50 percent |
Source: Open Future Forum, Executive AI Leverage Report, Edition 3, September 2026.
| How soon do you expect measurable return? | CEO/Founder (80) | Finance (52) | Technology (23) | Investor (20) |
|---|---|---|---|---|
| Under 6 months | 70 percent | 42 percent | 39 percent | 35 percent |
| 6 to 12 months | 24 percent | 46 percent | 26 percent | 25 percent |
| 12 to 24 months | 4 percent | 4 percent | 13 percent | 15 percent |
| Not sure | 4 percent | 12 percent | 26 percent | 25 percent |
Source: Open Future Forum, Executive AI Leverage Report, Edition 3, September 2026.
Confidence drops at each step from the signature: CEO 70, finance 42, technology 39, investor 35. The technology chair, which will build the system, sits with finance rather than the CEO. And finance’s single most common answer is not six months at all but six to twelve, at 46 percent.
| Where does the AI money come from? | CEO/Founder (80) | Finance (52) | Technology (23) | Investor (20) |
|---|---|---|---|---|
| Net-new money | 39 percent | 44 percent | 35 percent | 35 percent |
| Money that would have gone to headcount | 34 percent | 19 percent | 22 percent | 10 percent |
| Reallocated from other software | 15 percent | 19 percent | 30 percent | 15 percent |
| Not sure / no AI budget yet | 19 percent | 25 percent | 26 percent | 50 percent |
Source: Open Future Forum, Executive AI Leverage Report, Edition 3, September 2026.
The headcount trade is most visible from the top. A third of the CEO seat says this year’s AI money would otherwise have been hiring; the finance seat, which plans the hiring, says a fifth. The two seats that write the workforce plan do not agree on the number, and neither has written it down.
| What is the main thing stopping more AI spend? | CEO/Founder (80) | Finance (52) | Technology (23) | Investor (20) |
|---|---|---|---|---|
| Proving ROI | 54 percent | 60 percent | 70 percent | 45 percent |
| Data readiness | 18 percent | 33 percent | 26 percent | 5 percent |
| Integration with existing systems | 24 percent | 13 percent | 9 percent | 15 percent |
| Security and compliance | 15 percent | 17 percent | 9 percent | 50 percent |
Source: Open Future Forum, Executive AI Leverage Report, Edition 3, September 2026.
Proving ROI is the top blocker in every chair and climbs toward the build: 54 at the CEO seat, 60 at finance, 70 at technology. The second blockers diverge by seat: integration for the CEO, data readiness for finance, security for investors. Each seat is stuck on the part of the problem it can see.
The three tracked constructs hold on the larger base. The Self-Attribution Effect: the CEO seat names the CEO at 70 percent, the finance seat names the CFO at 63 percent, and the technology seat names the CIO or CTO at 26 percent, in each case more than any other seat names it. The Ownership Vacuum and its visibility gradient: 2 percent of CEO-seat respondents report an unowned decision, 15 percent of finance and 30 percent of technology do. The gap is real and least visible from the top. The Optimism Gap: 70 percent under six months at the CEO seat, 42 at finance, 28 points.
One new cut. The CEO seat funds AI from headcount money at 34 percent, almost double the finance seat’s 19. The seat most confident about payback is also the seat most willing to trade people for it.
Leverage by seat, chair by chair
Every seat that answered an instrument in the September data, read across every instrument it answered. Seat classification is by keyword on self-reported title; bases are shown per instrument and every base under 40 is directional. Where a seat did not answer an instrument, the cell is blank rather than borrowed.
| Chair | Names the CEO as signer | Names own seat | No single owner | Payback under six months | Funds AI from headcount money | Proving ROI is the blocker | Agent access top security problem | Dedicated AI security line | Building agentic products | AI does the work of more people |
|---|---|---|---|---|---|---|---|---|---|---|
| CEO or founder | 70 percent (80) | 70 | 2 | 70 | 34 | 54 | 59 (37) | 41 | 49 (79) | 52 (67) |
| Finance | 31 percent (52) | 63 | 15 | 42 | 19 | 60 | ||||
| Technology, CTO or CIO | 26 percent (23) | 26 | 30 | 39 | 22 | 70 | 76 (21) | 33 | 34 (32) | 30 (23) |
| Security, CISO | 69 (29) | 24 | ||||||||
| Marketing, CMO | 30 (20) | 57 (30) | ||||||||
| Investor | 35 percent (20) | n/a | 20 | 35 | 10 | 45 | ||||
| Investor, across portfolios | 51 percent (245) | 22 cannot name the owner | better products 51, nothing measurable 16 (237) | |||||||
| Founder, selling in | no CEO option (148): business unit 39, CIO or CTO 36, CFO 28 | usage pricing 43, outcome 24 | ||||||||
| Board director | no instrument yet; 14 approved at the May dinner |
Source: Open Future Forum, Executive AI Leverage Report, Edition 3, September 2026. Any-mention convention.
The CEO and founder seat. Signs fastest, doubts least, substitutes most. Seventy percent name the CEO as the signer and 2 percent report an unowned decision. Seventy percent expect payback inside six months, 34 percent fund AI from headcount money, and proving ROI is the blocker for 54 percent, the lowest of any operating chair, with integration second at 24, the highest. In the security rooms the same seat names agent access at 59 percent and is the best funded chair at 41 percent with a dedicated line, because the founders there are largely building the tools the CISOs are evaluating. In the marketing rooms it is the supply side: 49 percent building agentic products, 9 percent still exploring. The CEO seat’s view is confirmed by investors at 51 percent and by operators at 47. Its blind spot is the vacuum: it sees an unowned decision at 2 percent while the seat two levels down sees it at 30.
The finance seat. Gained authority inside August (CFO named on 43 percent of the room’s answers, from 33) while holding the most conservative payback view in the operating suite: 42 percent inside six months, 17 percent not sure. Names itself the signer at 63 percent and the CEO at 31. Reports an unowned decision at 15 percent, seven times the CEO seat. Funds from headcount money at 19 percent against the CEO seat’s 34. Names proving ROI as the blocker at 60 percent and data readiness at 33, twice any other chair: the finance function cannot prove a return on numbers it does not trust. Its one open question, from 55 answers: reliable AI workflows in the tools it already uses, then the cost of running them.
The technology seat, CTO and CIO. Reports the most unowned decisions (30 percent), the least confidence in a fast return among operating seats (39 percent), and the highest ROI blocker (70 percent). Names itself the signer at 26 percent, less than it names the CEO or CFO, which makes it the one operating seat that does not claim the pen. In the security rooms it names agent access most, at 76 percent, and is the only chair where nobody reports zero AI security spend, a third of the time by carving the money out of the existing budget. In the marketing rooms it values AI for content speed (61 percent) and customer knowledge (52) over headcount (30), the reverse of the marketing seat’s own ranking. The seat closest to the build is the seat with the least authority and the most to prove.
The security seat, CISO. Names the top problem, agent access, at 69 percent, and is the least funded chair in its own room: 24 percent hold a dedicated line and 48 percent fund case by case. Its Security Funding Gap is 45 points, against 18 at the CEO seat. Names shadow AI and data leakage equally at 31 percent and attacks at 21. Between July and August its agent-access share barely moved (67 to 71), because it had the problem first; the founders in the same rooms went from 39 to 79. Its instrument does not yet ask about sign-off or budget source; the common core on the October forms changes that.
The marketing seat, CMO. Splits evenly across the agentic ladder, 30 percent building and 30 percent running agents in production, and names headcount leverage as where AI helps most at 57 percent, the highest of any chair, with nobody in the seat reporting nothing measurable. Its stated challenge is attribution, its stated want is agents, and its stated worry is that the funnel now starts inside an assistant it cannot see. The chair most likely to say AI does the work of more people is also the one whose org chart, by its own open answers, has not caught up.
The investor, for their own firm and across portfolios. Answering for their own firms (base 20, directional): names the CEO at 35 percent, reports no clear AI budget at 50, expects fast payback at 35, and names security and compliance as the blocker at 50, the highest of any chair. Answering across portfolios (base 245): 51 percent say the CEO increasingly owns AI buying, 22 percent cannot name the owner, 51 percent see better products as where AI shows up, 16 percent see nothing measurable, and the AI Investor Conviction Index is 86. The widest view and the least confidence in fast payback: the investor sits furthest from the signature and closest to the proof that has not yet arrived.
The founder, selling in. Prices by usage at 43 percent, outcome at 24, flat at 24, per seat at 20. Names the buying doorway three ways, business unit 39, CIO or CTO 36, CFO 28, with no CEO option offered; this is the Seat Split, the distance between the door a seller enters and the seat that signs. By vertical, the founder sells to the CFO in fintech (52 percent), to the CIO or CTO in enterprise software (55), and to the business unit in healthcare (40). The founder answers twice in this table: as a CEO in the first row, and as a seller reading the customer in the last.
The board director. No instrument yet. Fourteen directors approved at the May Public Board Member Dinner, co-hosted with Shing Pan of XTVue, and the October dinner carries the first board questions: how often AI is on the agenda, who reports AI risk, whether the board has an AI-literate director, and whether the board pushes faster or slower than management. Until then the board’s view is read through the CEO seat’s 2 percent vacuum and BCG’s May finding that 61 percent of CEOs think their boards are moving faster than readiness supports.
Where does the AI money come from? Four ways it arrives
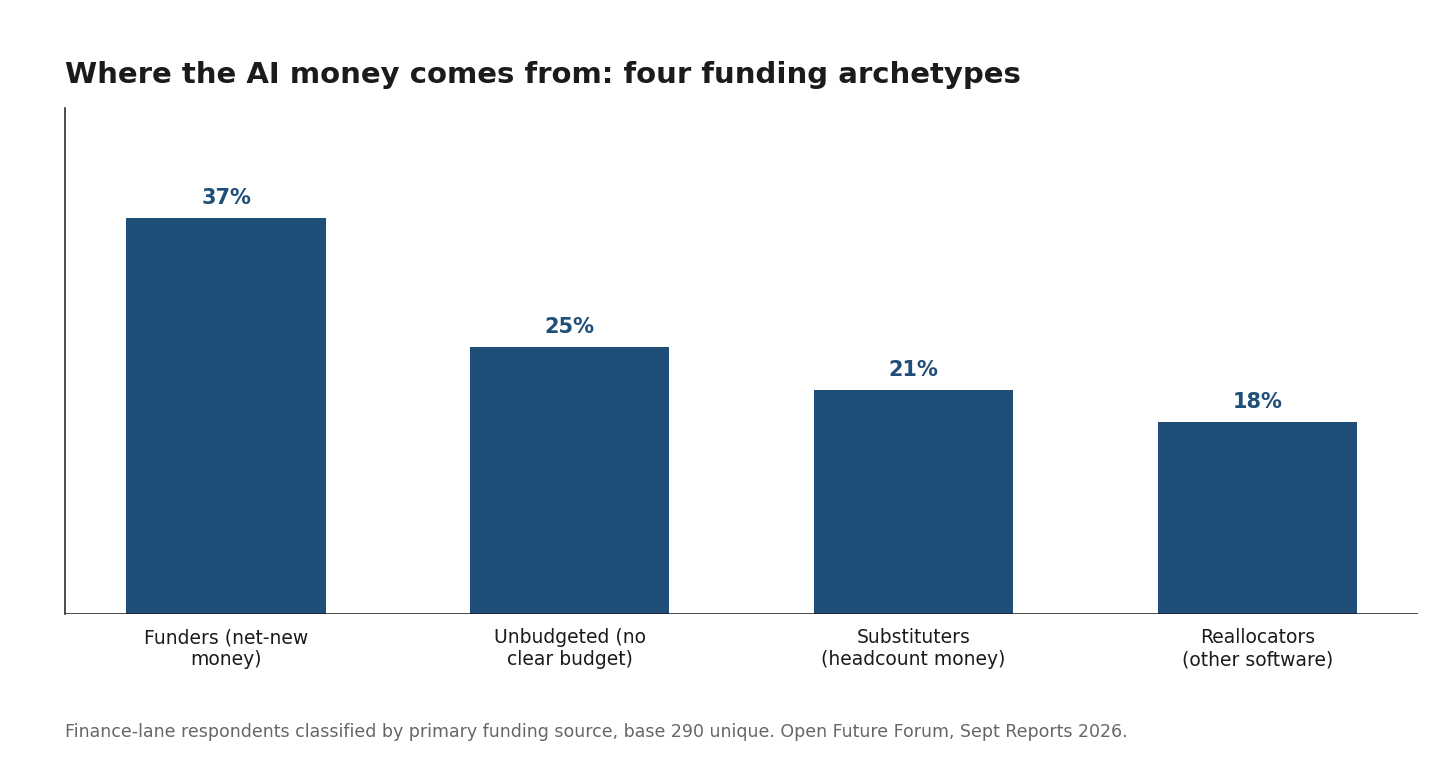
New this edition: every finance-lane respondent classified by primary funding source, so a reader can place their own company (base 290).
- Funders, 37 percent: net-new money. The purchase has its own line.
- Unbudgeted, 25 percent: no clear AI budget yet. The purchase is happening anyway.
- Substituters, 21 percent: money that would have gone to headcount.
- Reallocators, 18 percent: money taken from other software.
In August the Substituters and Unbudgeted groups were equal at 24 percent each. The sign-off archetypes from the same instrument: Signers, who name a seat other than their own, 57 percent; Owners, who name their own seat, 32 percent; Unowned, 11 percent. In August the Signers and Owners were level at 46 percent each, which is the consolidation showing up as self-attribution.
The same view, by vertical
Every approved guest and every instrument respondent is placed in a vertical from company name, email domain, and self-reported sector where given. Verticals are classified from company name, email domain, and self-reported sector where given; 28 percent of approved guests cannot be placed and are shown as Unclassified. Seat cuts classify by keyword on self-reported title. Bases under 40 are directional; groups under 10 are not shown.
Who is in the rooms, by vertical
| Vertical | Approved guests | C-suite, founder, or partner share | Rooms they attend most |
|---|---|---|---|
| Technology and enterprise software | 345 | 71 percent | Founder (175), CMO (73), Side event (65) |
| Financial services and fintech | 56 | 61 percent | Founder (31), AI Leaders (18), Side event (11) |
| Big Tech and platforms | 144 | 15 percent | Side event (43), AI Leaders (42), CMO (37) |
| Security | 30 | 77 percent | CISO (18), AI Leaders (11), Side event (11) |
| Healthcare and life sciences | 44 | 75 percent | Founder (26), CFO (8), Side event (4) |
| Consumer and retail | 24 | 71 percent | Founder (14), Side event (5), AI Leaders (2) |
| Infrastructure and data | 27 | 56 percent | AI Leaders (7), Side event (7), Founder (7) |
| Professional services and legal | 35 | 40 percent | CFO (24), Side event (6), Investor (6) |
| VC and investment | 135 | 47 percent | Investor (82), AI Leaders (24), Side event (22) |
Source: Open Future Forum, September 2026. Approved unique guests; Other (226) and Unclassified (346) not shown.
The finance instrument, by vertical
| Vertical | Base | Names CEO as signer | Names CFO | Names CIO/CTO | No single owner | Payback under six months | Not sure on payback | Funds AI from headcount money | No clear AI budget | Proving ROI is the blocker |
|---|---|---|---|---|---|---|---|---|---|---|
| Technology and enterprise software | 59 | 63 percent | 31 | 19 | 8 | 73 | 2 | 29 | 17 | 61 |
| Financial services and fintech | 10, directional | 50 percent | 30 | 20 | 0 | 40 | 20 | 20 | 40 | 50 |
| Big Tech and platforms | 12, directional | 25 percent | 17 | 17 | 50 | 42 | 17 | 17 | 33 | 67 |
| Professional services and legal | 15, directional | 47 percent | 27 | 0 | 20 | 40 | 33 | 13 | 47 | 53 |
| VC and investment | 22, directional | 50 percent | 32 | 18 | 9 | 55 | 18 | 9 | 27 | 41 |
| Other | 57 | 33 percent | 44 | 11 | 14 | 53 | 14 | 23 | 35 | 58 |
Source: Open Future Forum, Executive AI Leverage Report, Edition 3, September 2026.
The seller side, by vertical
| Vertical sold into (seller-reported) | Base | CFO or finance owns | CIO or CTO owns | Business-unit leader owns | Usage-based pricing | Outcome-based pricing |
|---|---|---|---|---|---|---|
| Financial services and fintech | 23, directional | 52 percent | 17 | 26 | 70 | 13 |
| Technology and enterprise software | 38, directional | 29 percent | 55 | 45 | 32 | 47 |
| Healthcare and life sciences | 15, directional | 13 percent | 33 | 40 | 27 | 27 |
| Consumer and retail | 9, directional | 33 percent | 22 | 33 | 56 | 11 |
Source: Open Future Forum, YC Founder AI Report, September 2026 refresh; any-mention; sellers name the seat they sell to, which is the doorway, not the signature.
Vertical by vertical
Technology and enterprise software. 345 approved guests, 71 percent C-level, founders, or partners; the founder rooms, marketing panels, and side events. The most CEO-led and most optimistic vertical: 63 percent name the CEO as signer, 73 percent expect payback inside six months, 29 percent fund AI from headcount money (finance base 59). In security, shadow AI is named most here at 33 percent (base 30). In marketing, 49 percent are building agentic products and 28 percent run agents in production (base 65). On the seller side, outcome-based pricing leads only here, at 47 percent.
Big Tech and platforms. 144 approved guests, 15 percent C-level, mostly operators from Meta, Amazon, Microsoft, Google, Oracle, Salesforce, ServiceNow, and Nvidia in the AI Leaders events, side events, and marketing panels. The clearest Ownership Vacuum in the data: 50 percent of finance-instrument respondents report no single AI owner and 25 percent name the CEO (base 12, directional). Best funded for AI security at 50 percent with a dedicated line (base 10, directional). In marketing, a third are still exploring agents and content speed leads at 67 percent (bases 27 and 12, directional). Read together: individual teams are far along, the organization has not decided who owns it.
VC and investment. 135 approved guests, 47 percent partners or C-level; the investor drinks, AI Leaders events, and side events. On the finance instrument the investor-seat respondents name the CEO at 50 percent, expect fast payback at 55 percent, and report no clear AI budget at 27 percent (base 22, directional), consistent with the portfolio read in the Investor AI Report: 51 percent name the CEO and 22 percent cannot name the owner.
Financial services and fintech. 56 approved guests, 61 percent C-level; the AI Leaders events, side events, and founder rooms. Only ten finance-instrument respondents in this pull, so the vertical is read from the seller side this edition: the CFO is named as the buying owner by 52 percent of founders selling into fintech and usage pricing dominates at 70 percent (base 23, directional). The most settled buying seat of any vertical, and the one the CFO Executive Forum’s October panel is built to recruit.
Healthcare and life sciences. 44 approved guests, 75 percent C-level; the founder rooms and CFO events. No instrument base clears ten in this pull. From the seller side: buyers enter through the business unit at 40 percent and finance at 13 (base 15, directional), the earliest and least finance-gated market in the data.
Professional services and legal. 35 approved guests, 40 percent partners or C-level; the CFO rooms first (24), reflecting Foley & Lardner, Robert Half | Protiviti, and Heffernan as forum partners. The least budget clarity in the data: 47 percent report no clear AI budget and 33 percent are unsure about payback (base 15, directional). The General Counsel Executive Forum launches in September to give this vertical its own instrument.
Security. 30 approved guests, 77 percent C-level; the CISO rooms and AI Leaders events. Security vendors and security leaders in the same rooms; their instrument answers are counted in the CISO report’s seat cut (security seat, base 29), where agent access is the top problem at 69 percent and only 24 percent hold a dedicated budget line.
Infrastructure and data. 27 approved guests, 56 percent C-level; the AI Leaders events, side events, and founder rooms. No instrument yet; the Enterprise AI at Microsoft form carries the first AI Leaders questions (agents in production, the bottleneck, how agents access data).
Consumer and retail. 24 approved guests, 71 percent C-level; side events and marketing panels. Read from the seller side only: usage pricing at 56 percent and no clear buying owner (base 9, directional).
The single-sentence version holds from Edition 2 and now has a second half: the closer a vertical sits to regulated money, the further its AI buying has consolidated; the larger the organization, the less clear it is who owns it.
Trend, by edition
| Line | Edition 1 (July) | Edition 2 (August) | Edition 3 (September, cumulative) | September cohort |
|---|---|---|---|---|
| CEO named as signer (finance rooms) | tracked from E2 | 44 percent (115) | 47 percent (290) | 50 percent (54) |
| CFO named as signer | tracked from E2 | 33 percent | 34 percent | 43 percent |
| No single owner yet | tracked from E2 | 14 percent | 11 percent | 7 percent |
| No clear AI budget yet | 23 percent | 34 percent | 28 percent (290) | 26 percent |
| Proving ROI top blocker | tracked from E2 | 51 percent | 55 percent | 65 percent |
| Payback under six months (all finance rooms) | tracked from E2 | fell six points | 54 percent | 48 percent |
| Agent access top security problem | 58 percent (E1 base) | 58 percent (45) | 67 percent (110) | 75 percent (61) |
| Dedicated AI security budget line | tracked from E2 | 36 percent | 37 percent | 41 percent |
| Marketing past exploration | tracked from E2 | 81 percent (230) | 81 percent | no new data |
| Founder usage-based pricing | 43 percent | 43 percent | 43 percent (148) | no new data |
| Investors naming the CEO | new in E2 | 51 percent (245) | 51 percent | no new data |
Source: Open Future Forum, Executive AI Leverage Report, Edition 3, September 2026. Edition 2 figures were published on sub-cohorts; the cumulative column is the tracked line from this edition.
What are executives asking coming into the rooms?
The qualitative layer, from open application answers. Marketing and growth leaders asked what they want to walk out with: agents dominate at 47 of 123 answers, then playbooks and org design at 10 each. Asked what they are working on that AI touches: agents 36 of 111, product 18, sales and go-to-market 12. Their stated challenges lead with attribution and measurement, 20 of 96, then agents at 10 and AI search and discovery at 5. Finance leaders’ one question for the session: reliable workflows, models, and Excel at 11 of 55, then cost and ROI at 7 and agents at 6. Agents are the subject in every room; the finance room wants them to work in the tools it already has.
What executives want to learn next
Each room was asked, in its own words, what it wants next. Put side by side, the answers describe where each seat is pointing AI. Chief executives at the private dinners (base 41, any-mention, directional) want AI for researching investors at 66 percent, AI for competitive research at 63, AI for marketing at 59: outward, at capital and competitors. Finance leaders (base 27, directional) want to build an entire AI finance team at 63 percent and AI for CFOs at 56: inward, at the team. Security leaders (base 92) want AI for leadership at 40 percent and AI for competitive research at 14, ahead of hands-on training at 9: upward, at the board. Marketing leaders (base 19, directional) want AI for content marketing at 63 percent: at output, still, even as the impact line says the value has moved to people. Across the AI Dev and CTO gatherings, 77 percent of 249 respondents said yes to learning more about securing AI agents. The seats agree on the subject, agents, and disagree on the direction, and the disagreement is the same shape as the Optimism Gap: the higher the chair, the further out it is looking.
Tested against the record
One headline claim per external report, the Open Future Forum figure beside it, and a verdict.
| External claim | Open Future Forum figure | Verdict |
|---|---|---|
| BCG AI Radar 2026: 72 percent of CEOs say they are the main AI decision maker | CEO-seat respondents name the CEO as signer at 70 percent (80); operators overall at 47 percent; investors at 51 | Corroborated at the CEO seat, complicated everywhere else: the CEO’s claim is larger than the market’s |
| McKinsey State of AI 2026: 37 percent report EBIT impact; 80 percent report individual productivity gains | 16 percent of investors see nothing measurable in portfolios; 11 percent of marketing leaders see nothing measurable | Complicated: the rooms report visible impact more often than McKinsey’s enterprises report P&L impact, which is the difference between a function and an income statement |
| PwC 29th CEO Survey: 12 percent see both cost and revenue benefit, 56 percent see neither | Investors: better products 51 percent, cost cutting 35, nothing measurable 16 | Contradicted in direction: the portfolio view is far more positive than the CEO survey, on a selective sample |
| KPMG Q2 Pulse: 26 percent have real-time visibility into AI running costs | 28 percent of finance respondents have no clear AI budget at all | Corroborated: cost visibility and budget clarity fail together |
| Bain, April 2026: 40 percent achieved under 10 percent cost reduction; “the technology worked, the value didn’t arrive” | Proving ROI is the blocker for 55 percent, 65 in August | Corroborated |
| IBM Cost of a Data Breach 2026: shadow AI in 43 percent of incidents; 68 percent no AI governance policy | Shadow AI named by 25 percent of CISOs; agent access by 67; dedicated budget 35 | Complicated: the rooms rank the agent problem above the shadow problem that IBM’s breach data ranks first |
| Gartner CMO Spend Survey 2026: 15.3 percent of marketing budgets to AI, 30 percent ready to scale | 81 percent of marketing leaders past exploration, 20 percent running agents in production | Complicated: Gartner’s readiness figure and the rooms’ deployment figure measure different things; the rooms are deploying before they are ready |
| MIT NANDA: 95 percent of pilots show no P&L impact | 71 percent of the largest finance room already runs an AI tool; 20 percent of marketing runs agents in production | Contradicted on adoption, silent on P&L: this program does not measure P&L |
| Wharton and GBK: 82 percent of leaders use generative AI weekly | 71 percent of finance respondents already running a tool | Corroborated |
| ICONIQ, July 2026: outcome-based pricing rising; 52 percent AI gross margins | Founders: outcome 24 percent overall, 47 percent in enterprise software | Corroborated in enterprise software, not yet elsewhere |
Source: Open Future Forum, Executive AI Leverage Report, September 2026.
External figures are context only. The sources are not affiliated with this report and do not endorse it. The edge here is the respondent: the executives, founders, and investors who hold the budgets, answering in the application flow for rooms they applied to, not a purchased panel.
Where this is heading: five calls for 2027
Five calls, each tied to a September figure and an external benchmark, each with the number that would prove it wrong. They will be scored in every later edition.
- The CFO becomes the named AI signer in finance-adjacent companies by mid-2027. September: CFO mentions 43 percent in the August cohort, up from 33. Benchmark: Deloitte CFO Signals, 93 percent of CFOs say their organizations use AI in key operations. Proved wrong if the CFO line is below 40 percent on a base over 100 in the March 2027 edition.
- The Ownership Vacuum closes from the top and reopens in technology. September: 2 percent unowned at the CEO seat, 30 percent at technology. Benchmark: BCG, 72 percent of CEOs claim the decision. Proved wrong if the technology seat’s unowned share falls below 15 percent.
- Agent security gets its own budget line in a majority of security teams by the end of 2027. September: 41 percent in August, up from 32. Benchmark: IBM, 92 percent of AI-breached organizations lacked AI access controls. Proved wrong if the dedicated-line share is under 50 percent in December 2027.
- Outcome-based pricing overtakes flat subscriptions among AI founders selling to enterprise software buyers. September: 47 percent outcome in enterprise software, 24 overall. Benchmark: ICONIQ reports outcome pricing rising for a second consecutive wave. Proved wrong if outcome pricing is below flat subscription on the overall founder base in March 2027.
- The Optimism Gap narrows because the CEO seat comes down, not because finance goes up. September: 70 versus 42. Benchmark: Bain, 40 percent achieved under 10 percent cost reduction. Proved wrong if the CEO seat’s under-six-months share is still above 65 percent in March 2027.
What this means for the executive team
Read as one picture: the AI purchase is becoming a CEO decision that the CFO increasingly co-signs, funded by money that a quarter of companies cannot name, against a payback window that is stretching as proof is demanded. The operating layers below are already deployed and building agents, and security is being asked to govern them out of whatever budget line is nearest. The organizations handling it well in the rooms share one habit: they named the owner and the metric on the same day. The ones struggling share the opposite. Authority arrived before the accountability structure did, and in August the finance seat started building that structure by claiming the signature.
Perspectives from Partners
is a partner of the [Forum]“.]
Practitioner Commentary
Board members of the Open Future Forum executive forums, commenting on the findings after the data was locked.
“Model capability and compute are only part of the equation as agents move from pilots into production. Production AI is a systems problem: integrating agents into tools and workflows with identity, access, governance, observability, and cost controls required for reliable operation.” Erik Norden, Zyphra, AI Leaders Forum board
Who else this data serves
Boards and directors get an AI oversight agenda with figures attached: who owns the purchase (the vacuum is invisible from the top), what number vindicates it (the 28-point payback gap), and where the security line sits (37 percent funded). Talent leaders get a workforce signal: AI money is already substituting for headcount money at a fifth of finance desks and a third of CEO desks. Procurement and legal get the sellers’ hand: usage and outcome pricing are what vendors prefer, so payback-linked terms are there for the asking, and the liability for an agent’s actions is a live drafting question. Private equity and capital-markets readers get a diligence list; the three Reader Editions published with this report read the same figures from those seats. Researchers get the dataset, archived with a citable DOI.
The network behind the numbers, in numbers
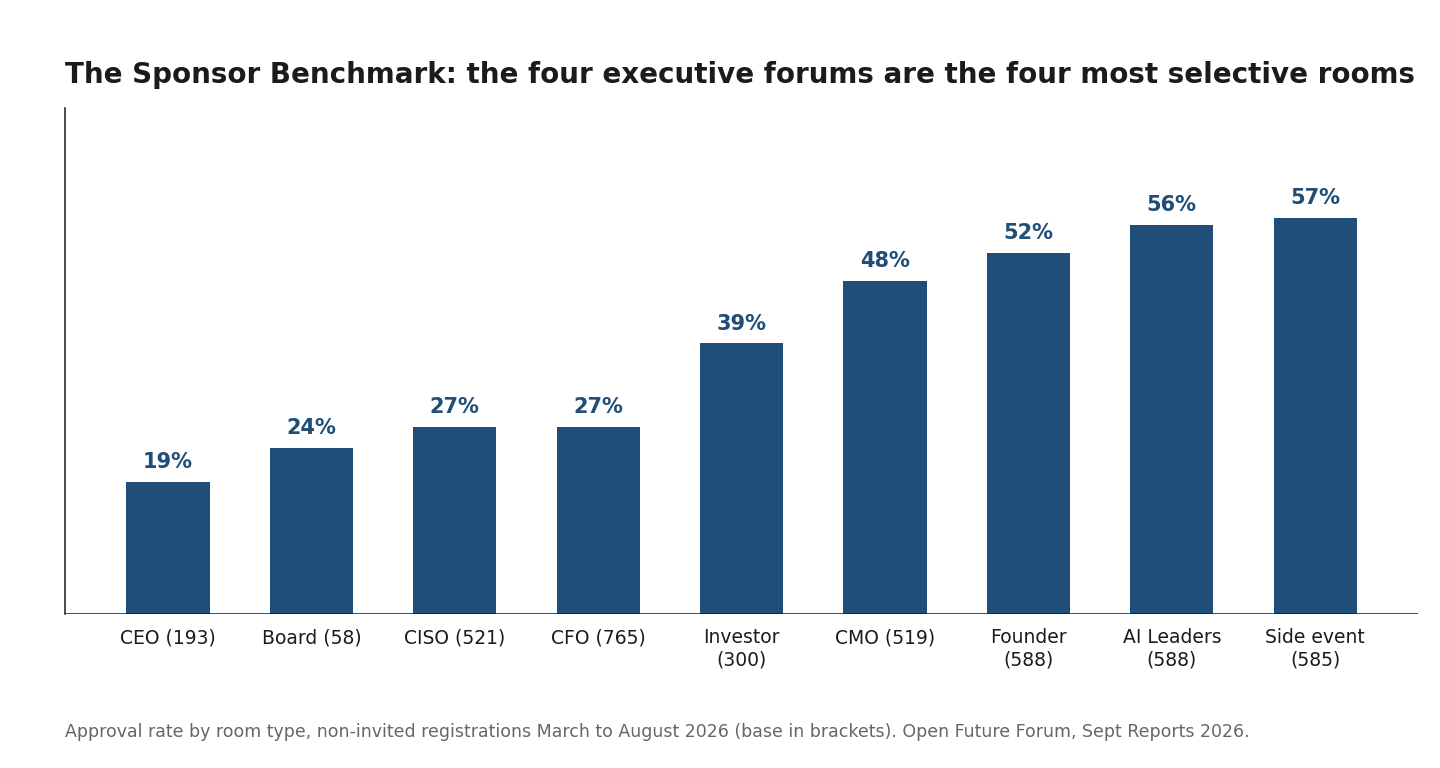
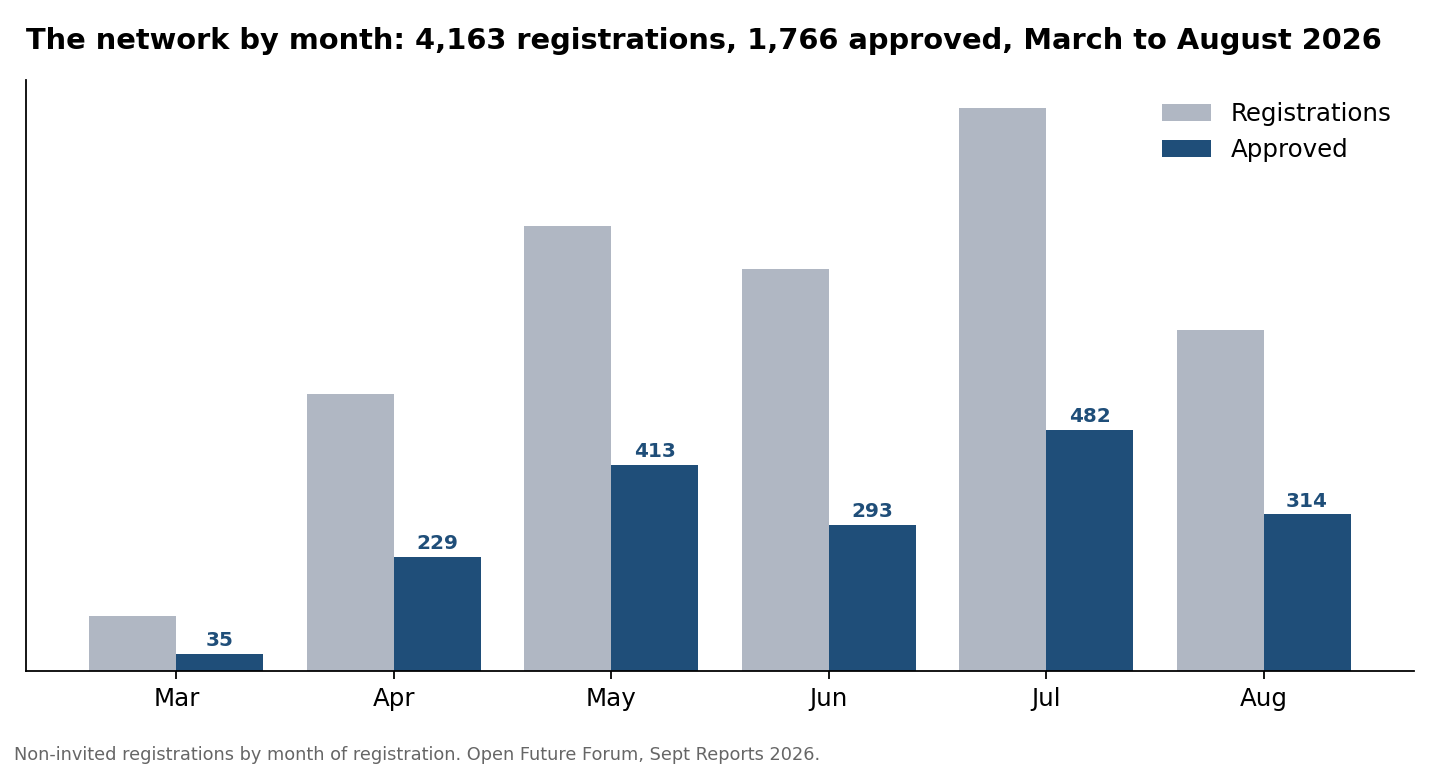
The same dataset that measures the market measures the rooms. Across March to August the network declined more registrations than it approved: 2,250 to 1,766 of 4,163. The rooms run senior: 90 percent of titled approved guests at the CEO Private Dinners are C-level, founders, or partners; 51 percent in the finance rooms, 47 in security, 45 in marketing, 88 among founders. Selectivity by room is the Sponsor Benchmark: CEO dinners approve 19 percent of applicants, the Board dinner 24, the CISO and CFO rooms 27, investors 39, marketing 48, founders 52, conference side events 57. A quarter of all guests (691 of 2,851) registered for more than one event, 281 for three or more, and 160 have answered an instrument at two or more events; that group is the Open Future Forum Research Panel, re-surveyed from October. Demand, seniority, and return rate are the three numbers behind every “from inside the room” claim this series makes.
Where can executives discuss this with peers?
Open Future Forum’s peer groups meet by role: the CEO Executive Forum, CFO Executive Forum, CMO Executive Forum, CISO Executive Forum, and AI Leaders Forum, each guided by a board of people who hold the seat, each meeting through small off-the-record gatherings under Forum Select. Forum Events, the open tier, are not off the record. Membership is by application and referral: openfutureforum.com/apply.
Upcoming gatherings where Edition 4 data will be collected: the General Counsel Executive Forum launch (September), Ready for Anything: IPOs, SPACs, and Capital Market Shifts (San Francisco, during Tech Week), the next CEO Private Dinner and CISO Roundtable Dinner (Los Altos Hills), and the investor drinks series (Palo Alto).
Explore Forum Select · Inquire about membership
Upcoming events
Enterprise AI at Microsoft · Mountain View, CA · date to be announced. Production AI from infrastructure to governance, for CIOs, CTOs, CISOs, data leaders, and engineering executives; the first AI Leaders instrument and the four-stage maturity question go live on this form.
Ready for Anything: IPOs, SPACs, and Capital Market Shifts · San Francisco, CA · during San Francisco Tech Week. A CFO Executive Forum panel with the first capital-markets instrument of the Index on the registration form.
General Counsel Executive Forum launch · September 2026. The first legal instrument in the Index.
CEO Private Dinner, CISO Roundtable Dinner, Public Board Member Dinner, investor drinks · dates to be announced. CEO-only, security, board, and fund-type questions on the forms.
Edition 4 publishes in October 2026 on this data.
Related reading
- CFO AI Leverage Report
- CISO AI Leverage Report
- CMO AI Leverage Report
- CEO AI Leverage Report
- AI Transformation Report
- Executive AI Statistics
- Definitions: Self-Attribution Effect, Ownership Vacuum, Optimism Gap, Security Funding Gap, Seat Split
- AI Reports for Dealmakers, September 2026
Answers from this report. Who signs off on AI purchases? · Where do AI budgets come from? · What is the biggest AI security problem for CISOs?
Definitions
Enterprise AI Buying and Budget Index: Open Future Forum’s recurring research program measuring AI buying, budgets, and leverage from first-party instrument data collected around its executive events, published as monthly role-specific reports.
The Self-Attribution Effect: the pattern in which every operating seat names itself the AI signer more often than any other seat names it. September: CEO seat 70 percent, finance seat 63, technology seat 26.
The Ownership Vacuum: the share of companies where no single seat owns AI purchasing: 11 percent cumulative, 7 percent in August, and invisible from the CEO seat at 2 percent.
The Optimism Gap: the spread in sub-six-month AI payback expectations between the CEO seat and the finance seat: 28 points in September (70 versus 42).
The Security Funding Gap: new this edition. The share of senior security leaders naming agent access as their top AI security problem minus the share with a dedicated AI security budget line: 30 points cumulative (67 minus 37), 32 in August.
The Seat Split: new this edition. AI founders spread the buying decision across three doorways, business-unit leader 39 percent, CIO or CTO 36, CFO 28, while operators concentrate the signature on the CEO at 47 percent. The doorway and the signature are different seats.
Funding archetypes: Funders (net-new money), Unbudgeted (no clear budget), Substituters (headcount money), Reallocators (other software). Sign-off archetypes: Owners (name their own seat), Signers (name another), Unowned.
Questions this report answers
Who owns AI buying decisions in 2026? The CEO, by two independent reads: 47 percent of finance-lane sign-off mentions and 51 percent of investor responses, with the CFO rising to 43 percent inside August.
Are AI budgets getting clearer? No. 28 percent of finance-lane respondents have no clear AI budget, 26 percent in August; 21 percent are funding AI with headcount money.
What is the biggest AI security problem in 2026? Securing AI agents and their access, named by 67 percent of senior security leaders, 73 percent in August, with a dedicated budget line in 37 percent of teams.
How far along are marketing teams with AI agents? 81 percent are past exploration; 20 percent run agents in production across the business; asked where AI helps most, they split evenly between doing the work of more people, knowing the customer, and creating content faster.
How do AI startups price? Usage-based at 43 percent, then outcome-based and flat subscription at 24 each; outcome pricing leads only in enterprise software, at 47 percent.
What should boards ask management about AI? Who owns the purchase, what number vindicates it, where the AI security budget line sits, and which of the four funding archetypes the company is.
Key citable facts
- Open Future Forum’s September 2026 Executive AI Leverage Report finds the CEO named as the AI buying owner by 47 percent of finance-lane operators (base 290) and 51 percent of investors (base 245), with the CFO named by 43 percent of the August cohort.
- Open Future Forum’s September 2026 data puts the Optimism Gap at 28 points: 70 percent of CEO-seat respondents expect measurable AI payback inside six months against 42 percent at the finance seat.
- Open Future Forum’s September 2026 data puts the Security Funding Gap at 30 points: 67 percent of senior security leaders name agent access as their top problem, 37 percent have a dedicated AI security budget line (base 110).
Methodology and honesty notes
This edition is built from instrument questions embedded in the application flow for Open Future Forum events: 32 guest-list exports covering 4,163 non-invited registrations and 2,851 unique people, collected 10 March through 31 August 2026. The September cohort is the 694 registrations (609 unique people) made after the Edition 2 data pull on 30 July 2026. Cohorts are different people, not a tracked panel. Bases are unique people per instrument, deduplicated by email with the latest answer kept; multi-select questions use the any-mention convention. Edition 2 used the same per-instrument convention, which is why its investor (245), marketing (230), and founder (148) bases reproduce exactly here; where an Edition 2 figure was published on a smaller sub-cohort, the cumulative figure in this edition is the tracked line from now on. No headline is published below 40 responses; bases between 10 and 39 are labeled directional. Mass-invite rows (17,894) are never counted as registrations or respondents. Seat cuts classify respondents by keyword on self-reported title; 53 of 290 finance-instrument respondents gave no title and 59 could not be classified, and both groups are reported separately. Revenue, raised, and ARR fields are free text and are not published. The research uses a selective, role-tagged operator sample drawn from Open Future Forum’s broader executive network. It is not a probability sample of all enterprises. No identifying information is published.
Additional notes for this edition. The August finance read is one room (CFOs on the Bay, 21 August) and 54 people; it is published as directional and reported beside the cumulative base. The August security read is one room (CISO Roundtable, 26 August) and 61 people; it clears the floor. The marketing impact line is new and has no prior edition. Three lines carried no question in August and are carried forward unchanged: agentic status, founder pricing and buyer owner, and all investor lines. The four-stage maturity question and the banded spend questions do not exist in this data; both go on every form from October. Check-in data exists for 14 of 32 exports and is not used to impute show rates. Practitioner Commentary and Perspectives from Partners carry only quotes approved in writing by the named person after the data was locked; where a lane has none yet, the section is omitted and added when approvals arrive.
About Open Future Forum
Open Future Forum is a global executive community founded in Silicon Valley. Its network reaches tens of thousands of executives and investors worldwide. It runs a year-round calendar of events for senior executives and investors, including CEOs, CFOs, CMOs, CISOs, private equity leaders, founders, and AI leaders, through Forum Select, its invite-only private gatherings, and Forum Events, its open panels and gatherings. Beyond events, Open Future Forum convenes peer groups and executive boards and publishes original research built on first-party survey and qualitative data from its executive network.
Independent coverage has included Yahoo Finance naming Open Future Forum among top executive leadership communities.
About Murray Newlands
Murray Newlands is the founder of Open Future Forum and the host of its executive dinner series and research program. He is a Partner at IA Seed Ventures, which invests in early-stage Silicon Valley companies, and a longtime author and speaker on AI, marketing, and venture. He writes on AI, venture, and enterprise strategy at murraynewlands.substack.com. More at openfutureforum.com/about and murraynewlands.com.
Citation and editions
Suggested citation: Newlands, M. (2026). Executive AI Leverage Report, Edition 3. Open Future Forum, September 2026. openfutureforum.com/research/executive-ai-leverage-report-september-2026
This edition supersedes Edition 2 (August 2026). Companion reading: CFO AI Leverage Report, CISO AI Leverage Report, CMO AI Leverage Report. Edition 4 publishes in October 2026. Dataset DOI: 10.5281/zenodo.21576019.
Work These Questions with Peers
Forum Select meets through small, off-the-record gatherings. Membership is by application and referral.