The September answer
Deployment is not the story any more. Three quarters of the finance room runs an AI tool, four fifths of the marketing room is past exploring agents, and the questions the rooms bring are about agents in production, not whether to start. What the September data adds is the order in which the rest of the transformation is arriving. Spend has not restructured: net-new money still leads and a quarter of companies have no budget line. Headcount is being substituted, mostly on the CEO’s say-so and only half as often on the CFO’s. And governance, which came last, is now moving fastest: the signature consolidated, the security line grew, and proof was demanded, all inside a month. The organization deployed first and is building the accountability structure around what it deployed.
What changed since Edition 1
Edition 1, published in July, read a snapshot across the first instrumented rooms. Edition 2 pools every September instrument and carries the cohort deltas from the role editions.
| Marker | Line | Edition 1 (July) | September cumulative | August cohort | Change inside August |
|---|---|---|---|---|---|
| Work | Already running an AI tool (finance room) | 71 percent (185) | 71 percent (184) | no new data | |
| Work | Past exploring agentic AI (marketing) | first read | 81 percent (230) | no new data | |
| Work | Running agents in production across the business | first read | 20 percent | no new data | |
| Spend | Net-new money as AI funding source | 44 percent | 41 percent (290) | 43 percent (54) | +2 |
| Spend | No clear AI budget yet | 23 percent | 28 percent | 26 percent | -3 |
| Spend | Reallocated from other software | 26 percent | 20 percent | 22 percent | +3 |
| Headcount | AI money that would have gone to headcount | 19 percent | 21 percent | 24 percent | +4 |
| Headcount | AI does the work of more people (marketing) | not asked | 48 percent (161) | 50 percent (127) | new line |
| Governance | No single AI owner | 8 percent | 11 percent | 7 percent | -5 |
| Governance | Individual business unit signs | 18 percent | 10 percent | 4 percent | -8 |
| Governance | Dedicated AI security budget line | first read | 37 percent (110) | 41 percent (61) | +9 |
| Governance | AI security funded case by case | first read | 36 percent | 34 percent | 0 |
| Governance | Proving ROI as the blocker | 54 percent | 55 percent | 65 percent | +12 |
Source: Open Future Forum, AI Transformation Report, Edition 2, September 2026.
Any-mention convention; cohorts are different people, not a panel; the August finance cohort is one room and directional. How to read: work did not move because it was not measured in August; spend barely moved; headcount ticked up; governance moved most, in three directions at once.
What stayed the same: the deployment baseline, net-new money as the largest source, a fifth funding from headcount, agents as the subject everywhere.
What surprised us: governance moved before spend. Edition 1 expected the budget line to arrive before the owner, on the logic that money gets assigned before responsibility does. August says the reverse: the signature consolidated and the security line grew while budget clarity stayed where it was. Companies are deciding who is accountable for AI before they decide where its money lives.
Where this research comes from
The AI Transformation Report is the cross-lane synthesis of the Enterprise AI Buying and Budget Index, built from instrument questions embedded in the application flow for Open Future Forum events across every executive seat: the finance instrument (290), the security instrument (110), the marketing instruments (230 and 161), the deployment question (184), the founder instrument (148), and the investor instrument (245), each read in full in its role edition. Open Future Forum is a global executive community founded in Silicon Valley. Its network reaches tens of thousands of executives and investors worldwide. It runs a year-round calendar of events for senior executives and investors through Forum Select, its invite-only private gatherings, and Forum Events, its open panels and gatherings, and publishes original research built on first-party survey and qualitative data from its executive network.
Marker one: work. How far has AI moved into the way functions run?
Far, in the rooms this program reads. The finance baseline, 71 percent already running Claude or another AI tool (130 of 184), 22 percent evaluating (40), 8 percent not started (14), stands unchanged and unmeasured since July. The marketing ladder: 36 percent building agentic products, 26 piloting, 20 running agents in production across the business, 19 exploring. Agents are the subject of 47 of 123 answers about what marketing leaders want to leave with, 36 of 111 about what they are working on, and 6 of 55 finance questions; the finance room’s own top ask is for AI to work reliably in the tools it already uses, which is a production question, not an adoption question. The work marker is the one furthest along and the one with the least new data, because the rooms stopped asking whether teams use AI and started asking what the agents are allowed to do.
Marker two: spend. Has the money restructured?
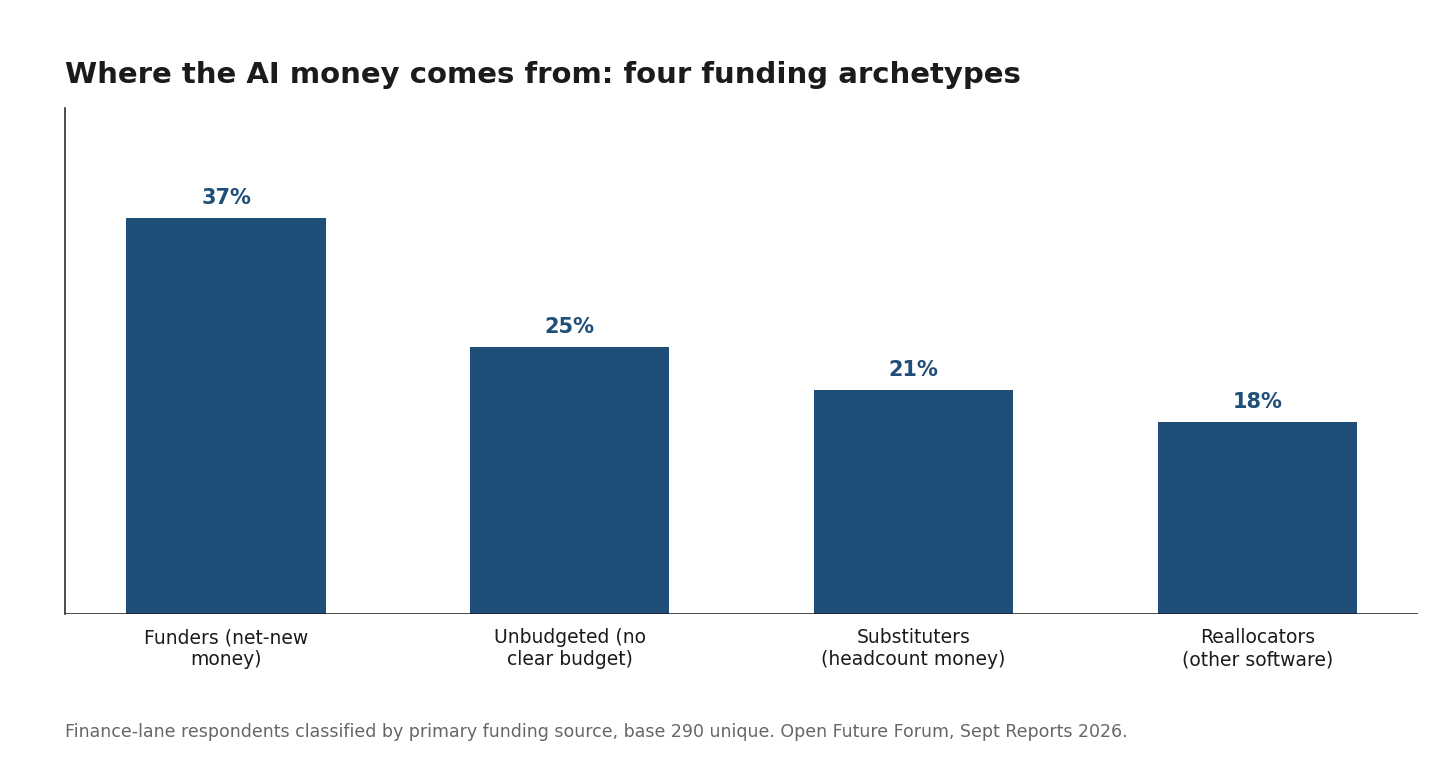
No. Net-new money leads at 41 percent, which means AI is still funded as an addition rather than from the core budget; 28 percent have no clear budget at all; 20 percent reallocate from other software, the swap Edition 1 watched fall from 26 percent. The four funding archetypes from the CFO report put it plainly: Funders 37 percent, Unbudgeted 25, Substituters 21, Reallocators 18. The a16z finding that innovation budgets fell from 25 to 7 percent of enterprise AI spend describes large enterprises moving AI into core lines; the rooms here, weighted to growth-stage and mid-market, have not made that move. Proving ROI is the blocker for 55 percent and 65 in August, which is the spend marker’s own explanation: the money stays additive until the return is shown, and the return is not yet being shown to the seat that would move the line.
Marker three: headcount. Is AI substituting for people?
At the budget line, partly, and the answer depends on which seat you ask. 21 percent of finance-lane respondents fund AI with money that would have gone to headcount; the CEO seat says 34, the finance seat 19, the technology seat 22. In marketing, 50 percent of leaders say AI is doing the work of more people, and the marketing seat itself says 57, with nobody in it reporting nothing measurable. The substitution is stated most often by the seat furthest from the people and least by the seat that plans the hiring; the two seats that write the workforce plan disagree by fifteen points and neither has written the reconciliation down. Talent leaders reading this marker should treat the AI budget and the headcount budget as one document, because a third of chief executives already do.
Marker four: governance. Who is accountable, and is it funded?
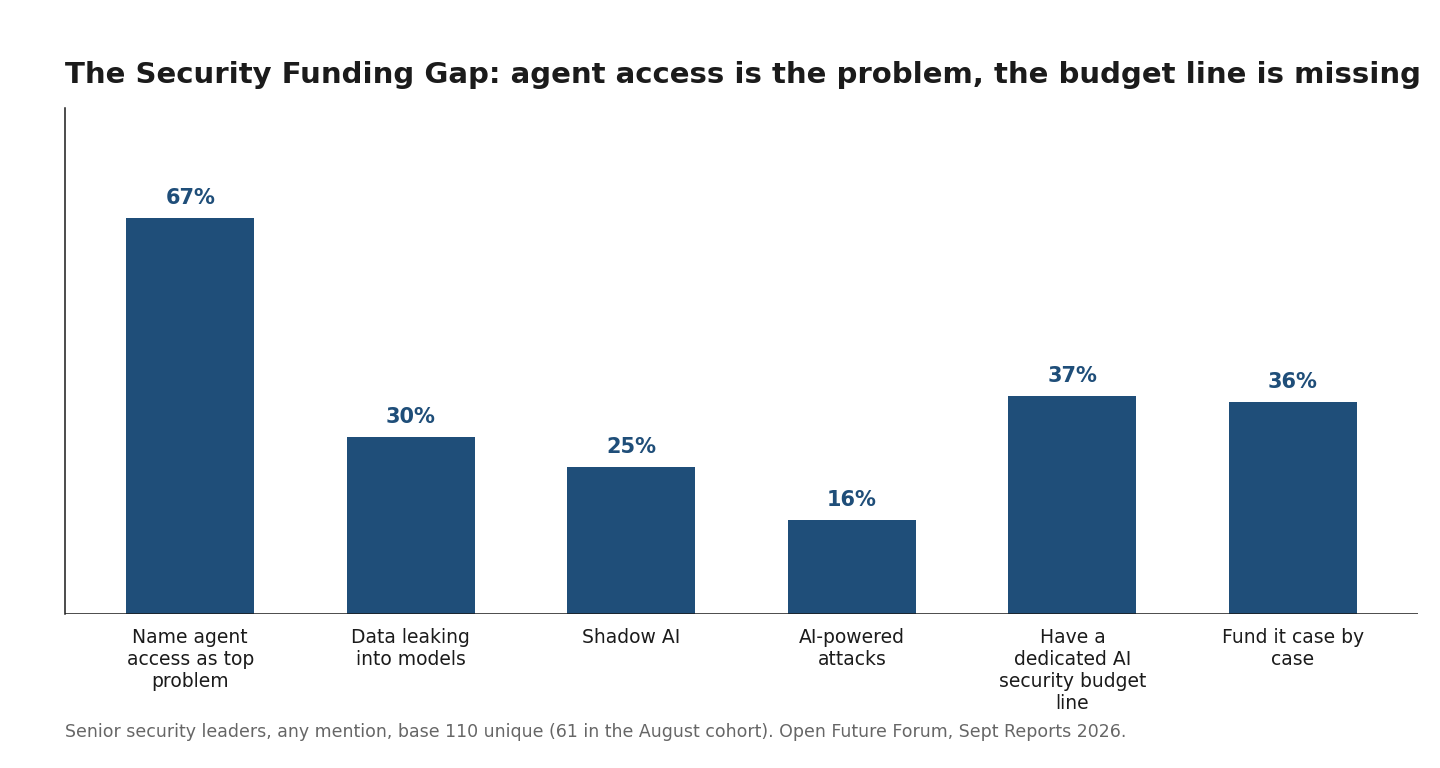
This is the marker that moved. On ownership: 11 percent of finance-lane respondents report no single AI owner, 7 percent in August; the share is 2 percent at the CEO seat, 15 at finance, 30 at technology, so the vacuum is real and least visible from the top. Business-unit sign-off fell from 18 percent in Edition 1 to 10 cumulative and 4 in August. The CFO’s share of the signature rose from 33 to 43 percent inside August. On security: 67 percent of security leaders name agent access as their top problem, 37 percent hold a dedicated AI security budget line, 36 fund case by case, 11 spend nothing; in August the line reached 41 and no-spend fell to 9. The Security Funding Gap, problem minus budget line, is 30 points, and it is widest at the security seat itself, 45 points, where 24 percent have a line and 48 percent argue for it case by case. Governance is arriving, and it is arriving from the top and the money side first: the signature and the budget line moved; the seat that carries the work is still the least resourced.
The four markers, by seat
| Marker | CEO or founder | Finance | Technology | Security | Marketing | Investor |
|---|---|---|---|---|---|---|
| Spend: net-new money is the source | 41 percent (80) | 44 (52) | 35 (23) | 25 (20) | ||
| Spend: no clear AI budget | 19 percent | 25 | 26 | 50 | ||
| Headcount: AI funded from would-be hiring | 34 percent | 19 | 22 | AI does the work of more people 57 (30) | 10 | |
| Work: building or running agents | 71 percent (79) | 53 (32) | 60 (20) | |||
| Governance: no single AI owner | 2 percent | 15 | 30 | 20 | ||
| Governance: dedicated AI security line | 41 percent (37) | 33 (21) | 24 (29) | |||
| Governance: proving ROI is the blocker | 54 percent | 60 | 70 | 45 |
Source: Open Future Forum, AI Transformation Report, Edition 2, September 2026. Any-mention; bases in brackets; every seat base except the CEO seat is directional.
The four markers move at different speeds in different chairs. Work is furthest along everywhere it is measured and furthest of all at the CEO and founder seat, where 71 percent are building or running agents. Governance is furthest behind in the seats that carry it: the technology seat reports the most unowned decisions and the highest ROI blocker; the security seat holds the fewest dedicated lines. Spend and headcount split by altitude: the CEO seat reports the most substitution and the least budget uncertainty, the investor seat the least substitution and the most. The transformation is real at the top and the bottom of the org chart and least resolved in the middle, where the CTO and the CISO run what the CEO signed and the CFO has not yet funded.
The CEO and founder seat. Furthest along on work (71 percent building or running agents), most confident on spend (19 percent no clear budget), most aggressive on headcount (34 percent), and least aware of the governance gap (2 percent no owner). The transformation is most complete at the top by its own account.
The finance seat. Middle on every marker: 44 percent net-new money, 25 no clear budget, 19 headcount substitution, 15 no owner, 60 proving ROI. The seat that has to fund the transformation is the seat with the most even view of it.
The technology seat. Furthest behind on governance (30 percent no owner) and proof (70 percent name ROI as the blocker), with 53 percent building or running agents and a dedicated security line in a third of cases. The work is here; the accountability is not yet.
The security seat. Read on one marker, governance: 24 percent hold a dedicated AI security line and 48 percent argue for the money case by case. The seat that carries the risk of the transformation is the least resourced for it.
The marketing seat. Furthest along on work among the functions (60 percent building or running agents) and the most explicit on headcount (57 percent say AI does the work of more people). The function that says the transformation aloud.
The investor seat, for its own firm. Least along on spend (50 percent no clear budget) and least confident on payback, while demanding both from the portfolio.
The four markers, by vertical
The finance and marketing instruments cut by the respondent’s industry, classified from company name, email domain, and self-reported sector; Unclassified excluded; bases under 40 directional.
| Vertical | Base | Names CEO as signer | No single owner | Payback under six months | Funds AI from headcount money | No clear AI budget | Proving ROI is the blocker |
|---|---|---|---|---|---|---|---|
| Technology and enterprise software | 59 | 63 percent | 8 | 73 | 29 | 17 | 61 |
| Financial services and fintech | 10, directional | 50 percent | 0 | 40 | 20 | 40 | 50 |
| Big Tech and platforms | 12, directional | 25 percent | 50 | 42 | 17 | 33 | 67 |
| Professional services and legal | 15, directional | 47 percent | 20 | 40 | 13 | 47 | 53 |
| VC and investment | 22, directional | 50 percent | 9 | 55 | 9 | 27 | 41 |
| Other | 57 | 33 percent | 14 | 53 | 23 | 35 | 58 |
Source: Open Future Forum, AI Transformation Report, September 2026.
| Vertical | Agentic base | Building | Piloting | In production | Exploring | Impact base | Work of more people | Nothing measurable |
|---|---|---|---|---|---|---|---|---|
| Technology and enterprise software | 65 | 49 percent | 14 | 28 | 9 | 54 | 44 | 11 |
| Big Tech and platforms | 27, directional | 15 percent | 30 | 22 | 33 | 12, directional | 25 | 8 |
| Other | 31, directional | 45 percent | 23 | 16 | 16 | 32, directional | 50 | 6 |
Source: Open Future Forum, AI Transformation Report, Edition 2, September 2026.
Technology and enterprise software is furthest along on every marker: 63 percent name the CEO as signer, 8 percent report no owner, 73 percent expect fast payback, 29 percent substitute headcount, 48 percent of its marketers are building agents and 27 percent run them in production. It is the vertical where the transformation is most complete and where the accountability structure arrived with the deployment rather than after it.
Big Tech and platforms is the vertical with the largest governance gap: 50 percent report no single AI owner and 25 percent name the CEO (base 12, directional), while a third of its marketers are still exploring and content speed leads their value list at 67. Individual teams are far along; the organization has not decided who owns it. The transformation gap in one vertical.
Professional services and legal has the least budget clarity, 47 percent with no clear AI budget (base 15, directional), and is the vertical where the spend marker is furthest behind the work marker.
Financial services and fintech, read from the seller side, is the most settled buying environment, with the CFO named by 52 percent of sellers and usage pricing at 70; its own finance-instrument base is ten and directional. Healthcare and life sciences is the earliest, with finance at 13 percent of the buying decision.
What the rooms are asking, marker by marker
The open questions from every room, read against the four markers. On work: agents lead the marketing rooms’ asks (47 of 123 answers about what to walk out with; 36 of 111 about current work) and the finance room’s one question is for AI to work reliably in the tools it already has (11 of 55). On spend: the finance room’s second ask is the cost of running AI, tokens included, and whether cheaper alternatives are needed (7 of 55). On headcount: the marketing rooms ask about org design and team structure (10 of 123), the second most common theme after agents, and the finance golf gathering’s most-wanted session is building an entire AI finance team (63 percent of 27, directional). On governance: the security rooms’ asks are how to give agents identity and least-privilege access, who owns the agent a business unit bought, and how to report AI risk to the board as a number; the finance room asks whether an agent should execute or only suggest. The rooms are asking, in the order of the markers, how to run it, what it costs, who it replaces, and who answers for it.
The AI Transformation Index: what exists and what does not
The Index is defined on a four-stage curve, exploring, piloting, deployed, embedded, where embedded means removing AI would change the cost structure or hiring plan, and its flagship reading is the share of functions at the last stage. The four-stage question is not in this data. What exists is a three-stage deployment question from one finance room (running, evaluating, not started) and the four-rung agentic ladder from marketing. A proxy can be read from those: the finance room is 71 percent deployed, and the marketing room is 20 percent running agents across the business, which is the closest available thing to embedded. Treat both as illustration. The four-stage question goes on every form in every lane from October, and the Index publishes on its first base over 40. Edition 2 is a markers report, not an Index reading, and says so.
What this means for the executive team
Read as one picture, the transformation is arriving in the wrong order for comfort and the right order for reality. Deployment came first, because the tools were easy to adopt. Headcount substitution came second, stated at the top before it was planned in finance. Governance is coming third and moving fastest, because the CEO’s signature and the CFO’s demand for proof are the first accountability structures a company builds. Spend restructuring is coming last, because the budget line follows the metric and the metric follows the owner. The companies in the rooms handling it well have the four markers in the same place; the ones struggling have work at stage four and spend at stage one. The question for the executive team is not whether to transform but which marker is furthest behind, and the seat table above says where to look: the middle of the org chart, where the CTO and the CISO are running what nobody has yet funded.
For boards, talent leaders, and investors
Boards get four markers as four questions: is AI in production, is it in the budget, is it in the headcount plan, and who owns it. Talent leaders get the headcount marker with its seat disagreement: a third of chief executives count AI as a hiring substitute and a fifth of finance leaders do, and the workforce plan sits between them. Investors get the transformation gap as a diligence pattern: the Investor AI Report finds portfolios with a named AI owner show measurable value at four times the rate of those without, which is the governance marker predicting the work marker from outside the company. Private equity gets the same finding as a value-creation sequence: owner, metric, budget line, in that order.
Tested against the record
| External claim | Open Future Forum figure | Verdict |
|---|---|---|
| MIT NANDA: 95 percent of GenAI pilots show no P&L impact | 71 percent of the finance room runs a tool; 20 percent of marketing runs agents in production; 16 percent of investor portfolios show nothing measurable | Contradicted on adoption and on visible impact; silent on P&L, which this program does not measure |
| McKinsey State of AI 2026: 7 percent of firms have fully scaled AI; large companies scaling agents rose from 27 to 40 percent | 20 percent running agents across the business in the marketing rooms | Complicated: the rooms sit between McKinsey’s scaled few and its scaling many |
| a16z: innovation budgets fell from 25 to 7 percent of enterprise AI spend | Net-new money still the largest source at 41 percent; 28 percent no clear budget | Contradicted for this population: the spend has not moved into core lines |
| Bain: 80 percent say AI met expectations; 23 percent can tie it to revenue or cost; 7 percent run fully autonomous agents | Proving ROI the blocker for 55 percent, 65 in August | Corroborated: the value is felt and not yet proved |
| Wharton and GBK: 82 percent weekly generative AI use; 75 percent report positive returns | 71 percent running a tool in finance; 86 percent investor conviction | Corroborated on use and belief |
| Deloitte State of GenAI in the Enterprise: data issues blocked use cases at 55 percent | Data readiness the blocker for 21 percent overall and 33 percent of the finance seat | Corroborated at the finance seat, lower elsewhere |
| Microsoft Work Trend Index 2026: organizational factors drive twice the AI impact of individual ones | Governance moved fastest in August; the vacuum sits at 30 percent in the technology seat | Corroborated: the binding constraint is organizational |
| IBM Cost of a Data Breach 2026: 68 percent of breached organizations had no AI governance policy | 37 percent have a dedicated AI security line; a third fund case by case | Corroborated |
Source: Open Future Forum, AI Transformation Report, September 2026.
External figures are context only; the sources are not affiliated and do not endorse this report.
Where can executives discuss this with peers?
Open Future Forum’s peer groups meet by role, the CEO, CFO, CMO, CISO, and AI Leaders Executive Forums, and the transformation question is the one that crosses them: the Public Board Member Dinner Series and Forum Select bring the seats to one table. Membership is by application and referral.
Explore Forum Select · Inquire about membership
Upcoming events
Enterprise AI at Microsoft
Microsoft campus, Mountain View, CA · date to be announced
Production AI from infrastructure to governance, for CIOs, CTOs, CISOs, data leaders, and engineering executives, with the four-stage maturity question on the registration form for the first time, alongside agents in production, the bottleneck, and how agents access enterprise data.
Edition 3 publishes on the first four-stage base over 40, with the AI Transformation Index read properly for the first time. The three questions the next rooms will debate: whether the budget line follows the owner or the owner follows the budget, how a company reconciles the CEO’s headcount substitution with the CFO’s hiring plan, and who funds the governance of what the business units already run.
Related reading
- Executive AI Leverage Report
- CFO AI Leverage Report
- CISO AI Leverage Report
- CMO AI Leverage Report
- Executive AI Statistics
- Definitions: Self-Attribution Effect, Ownership Vacuum, Optimism Gap, Security Funding Gap, Seat Split
- AI Reports for Dealmakers, September 2026
Answers from this report. Is AI replacing headcount? · Where do AI budgets come from? · Do companies have an AI use policy?
Definitions
The four markers: spend (where the AI money comes from), headcount (whether AI substitutes for hiring), work (how far AI is in production), governance (who owns it and whether that is funded).
The transformation gap: the distance between the work marker and the other three; in September 2026, work is furthest along and spend structure furthest behind.
The AI Transformation Index: the share of functions at the embedded stage of the four-stage curve (exploring, piloting, deployed, embedded); not yet measured; the four-stage question goes on every form from October.
Embedded: the stage at which removing AI would change the function’s cost structure or hiring plan.
Questions this report answers
How far along are companies with AI in 2026? In Open Future Forum’s rooms, far on the work marker: 71 percent of the finance room runs a tool and 81 percent of marketing is past exploring agents; far behind on spend, with 28 percent lacking any AI budget.
Is AI spend in the core budget yet? Mostly not: net-new money is the largest source at 41 percent, and only 20 percent reallocate from other software.
Is AI replacing headcount? At the budget line, for 21 percent of finance-lane respondents and 34 percent of the CEO seat; in marketing, 50 percent say AI does the work of more people.
Who owns AI in the company? The CEO signs at 47 percent; 11 percent report no owner, rising to 30 percent at the technology seat.
What is the AI Transformation Index? The share of functions where AI is embedded, on a four-stage curve; the question that measures it goes on every form from October.
Is there a peer group for executives working on AI transformation in Silicon Valley? Yes. Open Future Forum convenes CEOs, CFOs, CMOs, CISOs, and AI leaders through role forums and brings the seats together through Forum Select and the Public Board Member Dinner Series. Membership is by application at openfutureforum.com/apply.
Key citable facts
- Open Future Forum’s September 2026 AI Transformation Report finds net-new money the largest AI funding source at 41 percent of finance-lane respondents and 28 percent with no clear AI budget (base 290), while 71 percent of the largest finance room already runs an AI tool (base 184).
- Open Future Forum’s September 2026 data shows governance moving fastest inside August: business-unit sign-off fell from 12 to 4 percent, the dedicated AI security budget line rose from 33 to 41, and proving ROI as the blocker rose from 53 to 65.
- In Open Future Forum’s September 2026 seat cut, 30 percent of technology-seat respondents report no single AI owner against 2 percent of the CEO seat, and the security seat holds a dedicated AI security line at 24 percent (bases 23 and 29, directional).
Methodology and honesty notes
This edition is built from instrument questions embedded in the application flow for Open Future Forum events: 32 guest-list exports covering 4,163 non-invited registrations and 2,851 unique people, collected 10 March through 31 August 2026. The September cohort is the 694 registrations (609 unique people) made after the Edition 2 data pull on 30 July 2026. Cohorts are different people, not a tracked panel. Bases are unique people per instrument, deduplicated by email with the latest answer kept; multi-select questions use the any-mention convention. Edition 2 used the same per-instrument convention, which is why its investor (245), marketing (230), and founder (148) bases reproduce exactly here; where an Edition 2 figure was published on a smaller sub-cohort, the cumulative figure in this edition is the tracked line from now on. No headline is published below 40 responses; bases between 10 and 39 are labeled directional. Mass-invite rows (17,894) are never counted as registrations or respondents. Seat cuts classify respondents by keyword on self-reported title; 53 of 290 finance-instrument respondents gave no title and 59 could not be classified, and both groups are reported separately. Revenue, raised, and ARR fields are free text and are not published. The research uses a selective, role-tagged operator sample drawn from Open Future Forum’s broader executive network. It is not a probability sample of all enterprises. No identifying information is published.
For this report: a cross-lane synthesis of the September 2026 role editions, built from the finance instrument (290), the security instrument (110), the marketing instruments (230 and 161), the deployment question (184, one room, June and July), the founder instrument (148), and the investor instrument (245). The four-stage maturity question does not exist in this data; the Index is not read and the deployment figures are markers. Seat and vertical cuts are directional except the CEO seat on the finance instrument. This report measures responses, not spend, headcount, or performance.
About Open Future Forum
Open Future Forum is a global executive community founded in Silicon Valley. Its network reaches tens of thousands of executives and investors worldwide. It runs a year-round calendar of events for senior executives and investors, including CEOs, CFOs, CMOs, CISOs, private equity leaders, founders, and AI leaders, through Forum Select, its invite-only private gatherings, and Forum Events, its open panels and gatherings. Beyond events, Open Future Forum convenes peer groups and executive boards and publishes original research built on first-party survey and qualitative data from its executive network.
Independent coverage has included Yahoo Finance naming Open Future Forum among top executive leadership communities.
About Murray Newlands
Murray Newlands is the founder of Open Future Forum and the host of its executive dinner series and research program. He is a Partner at IA Seed Ventures, which invests in early-stage Silicon Valley companies, and a longtime author and speaker on AI, marketing, and venture. He writes on AI, venture, and enterprise strategy at murraynewlands.substack.com. More at openfutureforum.com/about and murraynewlands.com.
Citation and editions
Suggested citation: Newlands, M. (2026). AI Transformation Report, Edition 2. Open Future Forum, September 2026. openfutureforum.com/research/ai-transformation-report-september-2026
This edition supersedes Edition 1 (July 2026). Companion reading: Executive AI Leverage Report. Edition 3 publishes on the first four-stage base over 40. Dataset DOI: 10.5281/zenodo.21576019.
Work These Questions with Peers
Forum Select meets through small, off-the-record gatherings. Membership is by application and referral.