The September answer
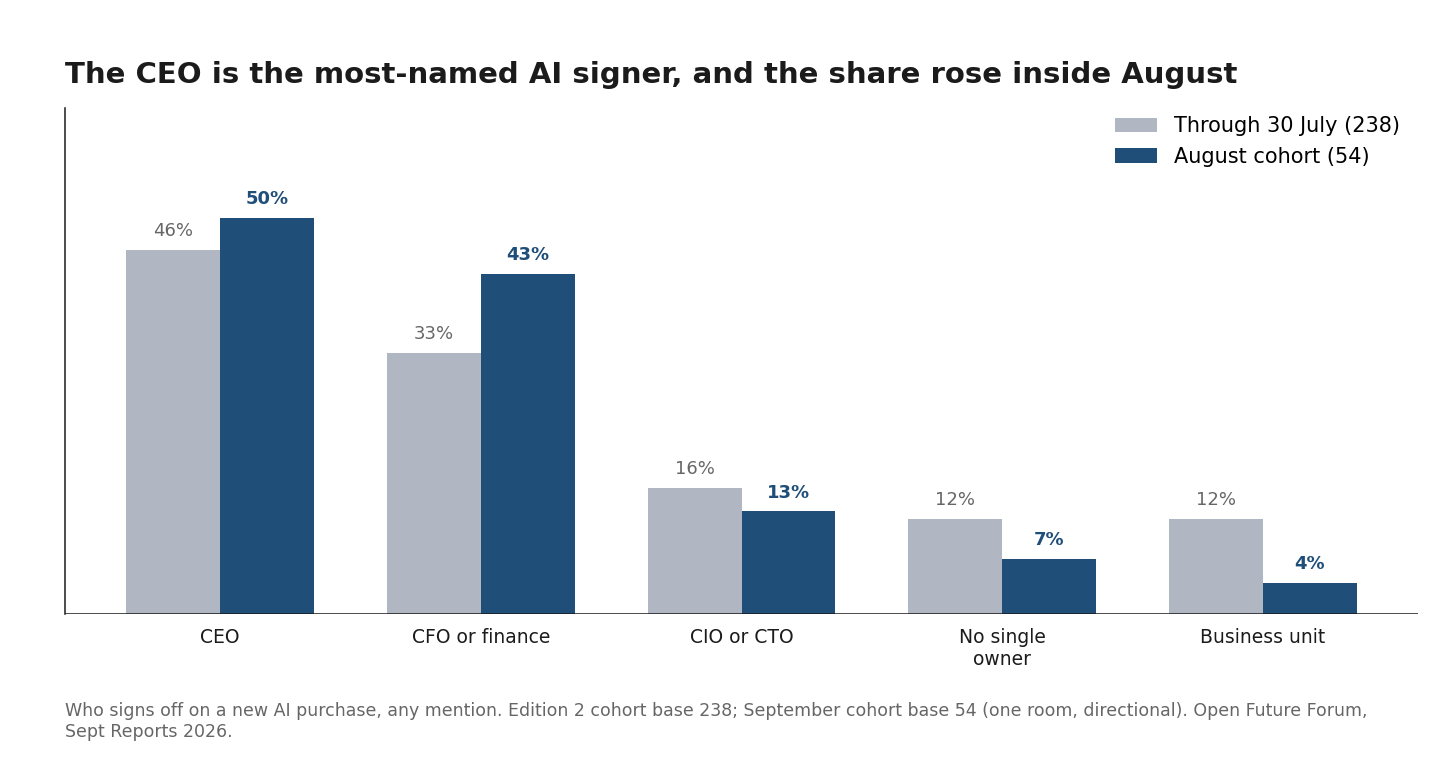
The finance seat took the pen in August. Across the four finance events since May, the CFO or finance had been named on a third of sign-off answers; in the one room that registered in August, CFOs on the Bay, it was named on 43 percent. In the same room, business-unit sign-off nearly disappeared, “no single owner” fell, and proving ROI rose twelve points as the thing stopping more spend. Read together: as the signature moves to finance, finance demands the proof, and the payback window stretches to accommodate the demand. What did not happen is the part the textbook predicts. Budget clarity did not improve. A quarter of the room still has no clear AI budget and a quarter is paying for AI with money it would otherwise have spent on people.
The August read is one room and 54 people, so it is published as directional beside the cumulative base of 290. What makes it worth publishing is direction: every line moved the way Edition 2 said it would, only harder.
What changed since Edition 2
Edition 2 compared two cohorts inside July. Edition 3 compares the cohort through 30 July, now 238 people across four events, with the 54 who applied after it. Same questions, same events program, later crowd.
| Question | Answer | Through July (238) | August (54) | Change |
|---|---|---|---|---|
| Who signs off | CEO | 46 percent | 50 percent | +4 |
| CFO or finance | 33 percent | 43 percent | +10 | |
| CIO or CTO | 16 percent | 13 percent | -3 | |
| Individual business unit | 12 percent | 4 percent | -8 | |
| No single owner yet | 12 percent | 7 percent | -5 | |
| AI budget source | Net-new money | 41 percent | 43 percent | +2 |
| Not sure / no AI budget yet | 29 percent | 26 percent | -3 | |
| Money that would have gone to headcount | 20 percent | 24 percent | +4 | |
| Reallocated from other software | 19 percent | 22 percent | +3 | |
| Main blocker | Proving ROI | 53 percent | 65 percent | +12 |
| Integration with existing systems | 20 percent | 22 percent | +2 | |
| Data readiness | 21 percent | 19 percent | -2 | |
| Security and compliance | 21 percent | 17 percent | -4 | |
| ROI window | Under 6 months | 55 percent | 48 percent | -7 |
| 6 to 12 months | 22 percent | 28 percent | +6 | |
| Not sure | 12 percent | 13 percent | +1 |
Source: Open Future Forum, CFO AI Leverage Report, Edition 3, September 2026.
Multi-select questions use the any-mention convention, so columns can sum past 100 percent. How to read month over month: different respondents at different events inside one network, not a tracked panel. Single-digit moves are noise; the two double-digit moves, the CFO’s share and the ROI blocker, are the story.
What stayed the same: the CEO as the most-named signer, net-new money as the most common funding source, proving ROI as the top blocker, and the headcount-money share at roughly a fifth to a quarter.
What surprised us: sign-off consolidated toward finance without the budget consolidating with it. In Edition 2 we expected the two to move together, on the theory that whoever holds the pen soon holds the line item. August says the signature arrives first and the budget line follows later, if at all. Finance is being asked to approve money that has not been assigned a home.
A reconciliation note. Edition 2’s headline figures were published on sub-cohorts of 91 and 115. This edition pools every finance-lane respondent under one convention, unique people per instrument, so its cumulative figures (CFO 34 percent, no clear budget 28, CEO 47) are the tracked lines from now on, and Edition 2’s sit beside them as history.
Where this research comes from
The CFO AI Leverage Report is built from instrument questions embedded in the application flow for Open Future Forum’s finance events, including gatherings convened with the CFO Executive Forum, the network’s invitation-only peer group for senior finance leaders, co-chaired by Murray Newlands and Christina Bui of Robert Half, with Louis Lehot of Foley & Lardner and Ellie Yashiro of Silicon Valley Bank on the board. This edition draws on four instrumented finance events between May and August 2026: AI as a Force Multiplier, Claude for Finance, the CFO Playbook for Value Creation, and CFOs on the Bay, plus the golf gatherings and the Giants Game, which carried screening questions only. Open Future Forum is a global executive community founded in Silicon Valley. Its network reaches tens of thousands of executives and investors worldwide. It runs a year-round calendar of events for senior executives and investors through Forum Select, its invite-only private gatherings, and Forum Events, its open panels and gatherings, and publishes original research built on first-party survey and qualitative data from its executive network.
Who signs off on AI purchases in finance organizations now?
The CEO, still, on 47 percent of answers across 290 finance-lane respondents, and 50 percent in August. But the movement underneath is the finding. The CFO’s share rose ten points in a month to 43 percent. Business-unit sign-off, which had already halved inside July, fell again to 4 percent. “No single owner yet,” which Edition 2 called the Ownership Vacuum and watched double, came back down to 7 percent in August. Read in sequence across three editions, the pattern is the end of the experimental phase: companies pulled AI purchasing out of individual departments in July, held it in limbo for a month, and in August began handing it to finance. The CEO signs; the CFO increasingly co-signs.
Two cautions. The August room was a finance room, and finance leaders are more likely than other seats to name their own chair, which the seat cut below quantifies. And 54 is a directional base. The cumulative CFO share of 34 percent is the tracked figure; the 43 is the direction of travel.
Where do AI budgets come from in late 2026?
Net-new money, at 41 percent of the full base and 43 in August. The second-order story is that nothing else moved much: no clear budget 28 percent, headcount money 21, reallocated software 20. The software swap that Edition 2 watched collapse from 26 to 14 percent has settled at about a fifth. The headcount line is the one to watch. At 21 percent on the full base and 24 in August, a quarter of finance desks are already treating AI spend and hiring spend as the same money, and, as the seat cut shows, the CEO seat says so at nearly double the finance seat’s rate.
Deployment has not waited for the budget. The Claude for Finance baseline stands: 71 percent of the largest finance room already runs Claude or another AI tool, 22 percent are evaluating, 8 percent have not started (base 184, June and July, no new data). Three quarters of the room is running AI; a quarter cannot name the budget it runs on.
Four ways the AI money arrives
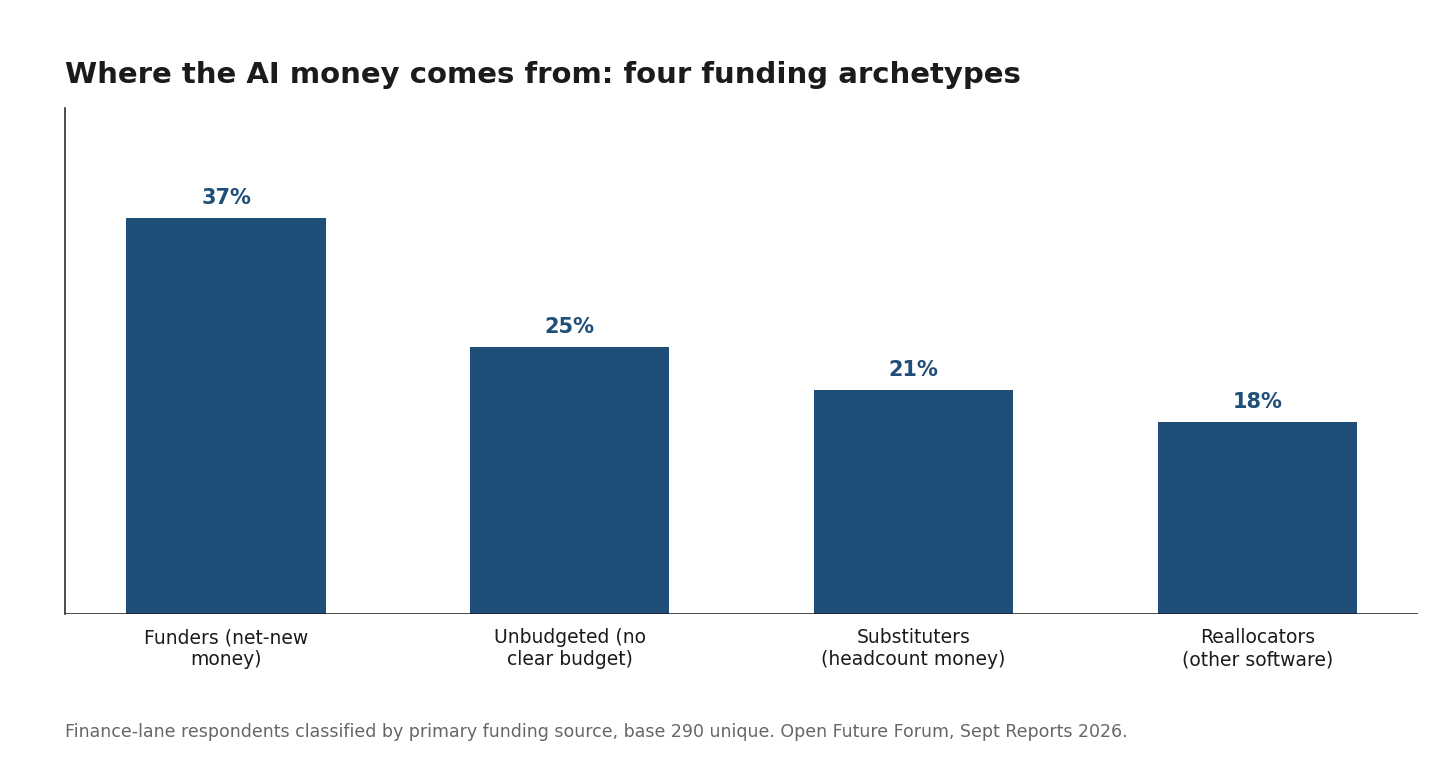
New this edition: every finance-lane respondent classified by primary AI funding source, so a reader can place their own company (base 290).
- Funders, 37 percent: net-new money. The purchase has its own line.
- Unbudgeted, 25 percent: no clear AI budget yet. The purchase is happening anyway.
- Substituters, 21 percent: money that would have gone to headcount.
- Reallocators, 18 percent: money taken from other software.
In August: Funders 33 percent, Substituters 24, Unbudgeted 24, Reallocators 19. Each archetype carries a different question for the CFO. A Funder needs a metric, because net-new money is the easiest to cut when the board asks what it bought. An Unbudgeted company has made a purchase without a plan and will be asked for one at the next audit, financing, or transaction. A Substituter has made an operating-model claim that finance will be asked to prove in headcount not hired. A Reallocator has already found the money once and will be asked where the next dollar comes from when the software line is spent.
The same numbers, seat by seat
Edition 2 first split the finance instrument by the chair the respondent holds. Edition 3 carries the cut on bases that clear the floor for the two seats that matter most: CEO and founder respondents 80, finance seat 52. Technology (23) and investor (20) seats are directional. A further 53 respondents gave no title and 59 could not be classified; they stay in the network-wide figures.
| Who signs off on a new AI purchase? | CEO/Founder (80) | Finance (52) | Technology (23) | Investor (20) |
|---|---|---|---|---|
| CEO | 70 percent | 31 percent | 26 percent | 35 percent |
| CFO or finance | 30 percent | 63 percent | 30 percent | 20 percent |
| CIO or CTO | 15 percent | 10 percent | 26 percent | 5 percent |
| Individual business unit | 4 percent | 4 percent | 9 percent | 25 percent |
| No single owner yet | 2 percent | 15 percent | 30 percent | 20 percent |
Source: Open Future Forum, CFO AI Leverage Report, Edition 3, September 2026.
The diagonal holds on the larger base. CEO respondents name the CEO at 70 percent; finance respondents name the CFO at 63 percent; technology respondents name the CIO or CTO at 26, more than any other seat names it. Edition 2 read 84 percent at the CEO seat on a base of 43; on 80 people it is 70, a more modest number and a sturdier one. The Self-Attribution Effect is confirmed: the signature looks closest from the chair that holds it, and three seats still each believe the pen is on their own desk.
The bottom row is the Ownership Vacuum’s visibility gradient. Two percent of CEO-seat respondents report an unowned AI decision. Fifteen percent of the finance seat does, and 30 percent of the technology seat. The uncertainty is least visible from the top of the org chart and most visible one level down, where the implementation lives. A CFO who is told by the CEO that the decision is owned should ask the CTO.
| How soon do you expect measurable return? | CEO/Founder (80) | Finance (52) | Technology (23) | Investor (20) |
|---|---|---|---|---|
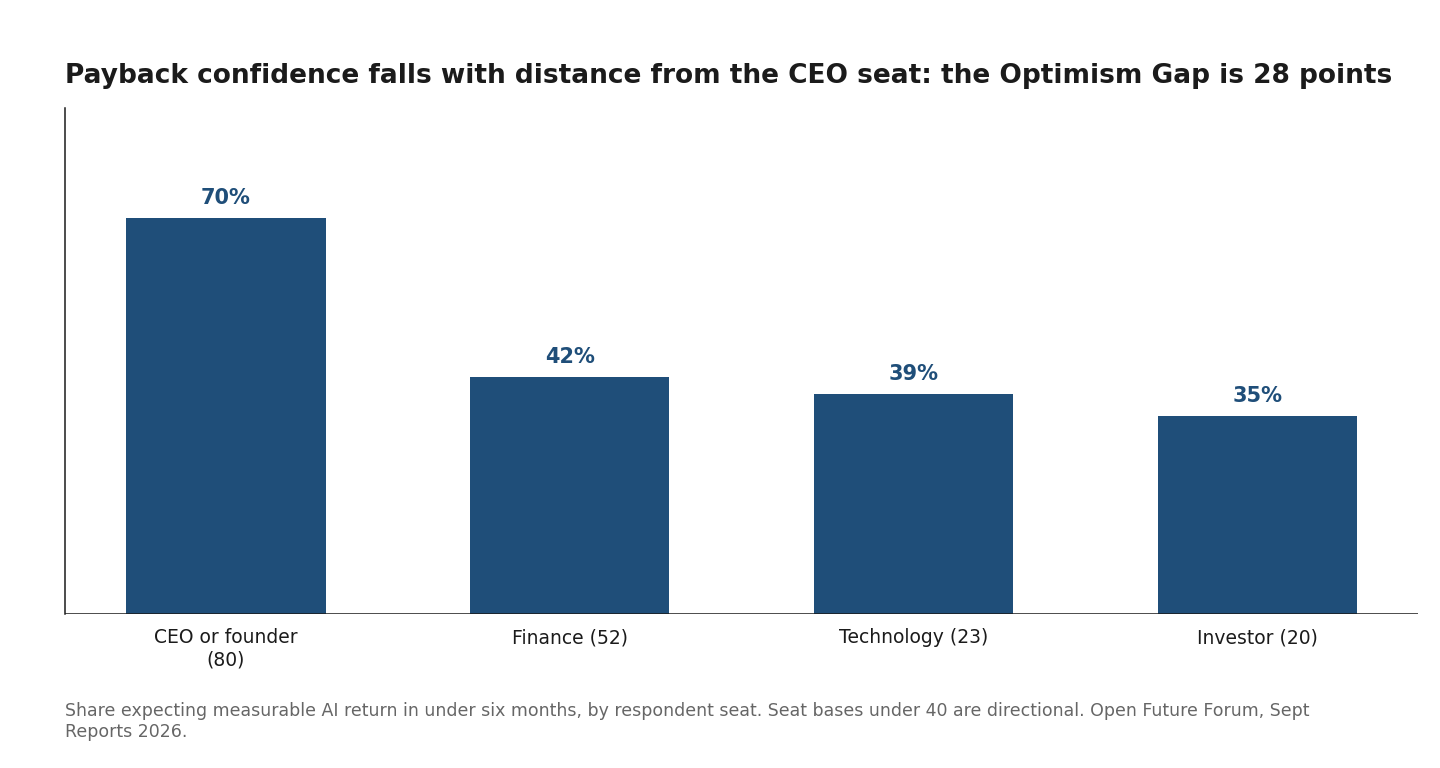
| Under 6 months | 70 percent | 42 percent | 39 percent | 35 percent |
| 6 to 12 months | 24 percent | 46 percent | 26 percent | 25 percent |
| 12 to 24 months | 4 percent | 4 percent | 13 percent | 15 percent |
| Not sure | 4 percent | 12 percent | 26 percent | 25 percent |
Source: Open Future Forum, CFO AI Leverage Report, Edition 3, September 2026.
The Optimism Gap, 27 points in August, is 28 in September: 70 percent of the CEO seat expects payback inside six months and 42 percent of the finance seat agrees. Confidence falls with every step away from the signature: CEO 70, finance 42, technology 39, investor 35. The finance seat is three times as likely as the CEO seat to answer “not sure,” and nearly half of it expects the return in six to twelve months, the single most common finance answer. A CFO walking into an AI proposal with the chief executive should assume that gap before the conversation starts, and should know that the technology seat, the one that will build it, sits closer to finance’s view than to the CEO’s.
| Where does the AI money come from? | CEO/Founder (80) | Finance (52) | Technology (23) | Investor (20) |
|---|---|---|---|---|
| Net-new money | 39 percent | 44 percent | 35 percent | 35 percent |
| Money that would have gone to headcount | 34 percent | 19 percent | 22 percent | 10 percent |
| Reallocated from other software | 15 percent | 19 percent | 30 percent | 15 percent |
| Not sure / no AI budget yet | 19 percent | 25 percent | 26 percent | 50 percent |
Source: Open Future Forum, CFO AI Leverage Report, Edition 3, September 2026.
The headcount trade is most visible from the top: 34 percent of the CEO seat says this year’s AI money would otherwise have been headcount spend, against 19 percent of the finance seat. Whatever the org chart says publicly, the seat that plans headcount is already treating AI as its substitute, and the seat that has to hire is not yet counting it that way. The gap between the two is the workforce plan nobody has written down.
| What is the main thing stopping more AI spend? | CEO/Founder (80) | Finance (52) | Technology (23) | Investor (20) |
|---|---|---|---|---|
| Proving ROI | 54 percent | 60 percent | 70 percent | 45 percent |
| Data readiness | 18 percent | 33 percent | 26 percent | 5 percent |
| Integration with existing systems | 24 percent | 13 percent | 9 percent | 15 percent |
| Security and compliance | 15 percent | 17 percent | 9 percent | 50 percent |
| Talent | 15 percent | 12 percent | 9 percent | 0 percent |
Source: Open Future Forum, CFO AI Leverage Report, Edition 3, September 2026.
New this edition. Proving ROI is the top blocker in every chair, and it climbs the closer the chair sits to the build: 54 percent at the CEO seat, 60 at finance, 70 at technology. The second blockers diverge. The CEO seat names integration; the finance seat names data readiness at a third, twice the CEO seat’s rate; investors, answering for their own firms, name security and compliance at half. The finance seat’s data problem is the one to note: a CFO cannot prove ROI on data the finance function does not trust, and a third of the seat says that is where it is stuck.
Chair by chair. The CEO and founder seat signs at 70 percent, doubts least (4 percent unsure), substitutes most (34 percent headcount money), and names integration as its second blocker, the only chair to do so. The finance seat names itself the signer at 63, reports an unowned decision at 15, expects payback in six to twelve months more often than in six (46 against 42), and names data readiness as the blocker at 33, twice any other chair. The technology seat reports the vacuum at 30, names itself least (26), expects fast payback least among operators (39), reallocates from other software most (30), and names proving ROI at 70, the highest of any chair. The investor seat, answering for its own firm, has the least budget clarity (50 percent no clear budget), the lowest payback confidence (35), and names security and compliance as the blocker at half. Read down the columns: authority and optimism sit at the top, the vacuum and the proof burden sit one and two levels down, and the finance seat is the chair that has to reconcile the two.
The same view, by vertical
New this edition: the finance instrument cut by the respondent’s industry, classified from company name, email domain, and self-reported sector where given. 92 of 290 respondents cannot be placed and are shown as Unclassified; groups under 10 are not shown; bases under 40 are directional.
| Vertical | Base | Names CEO as signer | Names CFO | Names CIO/CTO | No single owner | Payback under six months | Not sure on payback | Funds AI from headcount money | No clear AI budget | Proving ROI is the blocker |
|---|---|---|---|---|---|---|---|---|---|---|
| Technology and enterprise software | 59 | 63 percent | 31 | 19 | 8 | 73 | 2 | 29 | 17 | 61 |
| Financial services and fintech | 10, directional | 50 percent | 30 | 20 | 0 | 40 | 20 | 20 | 40 | 50 |
| Big Tech and platforms | 12, directional | 25 percent | 17 | 17 | 50 | 42 | 17 | 17 | 33 | 67 |
| Professional services and legal | 15, directional | 47 percent | 27 | 0 | 20 | 40 | 33 | 13 | 47 | 53 |
| VC and investment | 22, directional | 50 percent | 32 | 18 | 9 | 55 | 18 | 9 | 27 | 41 |
| Other | 57 | 33 percent | 44 | 11 | 14 | 53 | 14 | 23 | 35 | 58 |
Source: Open Future Forum, CFO AI Leverage Report, Edition 3, September 2026.
The seller side of the same verticals, from the founder instrument, shows which seat the vendors selling in believe owns the purchase and how they price for it:
| Vertical sold into (seller-reported) | Base | CFO or finance owns | CIO or CTO owns | Business-unit leader owns | Usage-based pricing | Outcome-based pricing |
|---|---|---|---|---|---|---|
| Financial services and fintech | 23, directional | 52 percent | 17 | 26 | 70 | 13 |
| Technology and enterprise software | 38, directional | 29 percent | 55 | 45 | 32 | 47 |
| Healthcare and life sciences | 15, directional | 13 percent | 33 | 40 | 27 | 27 |
| Consumer and retail | 9, directional | 33 percent | 22 | 33 | 56 | 11 |
Source: Open Future Forum, YC Founder AI Report, September 2026 refresh; any-mention; sellers name the seat they sell to, which is the doorway, not the signature.
Technology and enterprise software. The most CEO-led vertical in the data: 63 percent name the CEO, 8 percent report no owner, 73 percent expect payback inside six months, the most optimistic group in any cut, and 29 percent fund AI from headcount money, the highest substitution rate. This is the vertical where the CEO’s signature and the CEO’s optimism travel together.
Big Tech and platforms. The mirror image, on a small base (12): 50 percent report no single owner and only 25 percent name the CEO. This is what a matrixed purchasing process looks like from inside a large organization, where individual teams are far along and the company has not decided who owns it.
Professional services and legal. The least budget clarity in the data: 47 percent report no clear AI budget and 20 percent are unsure about payback (base 15, directional). Fifteen of the seventeen respondents came through the CFO rooms, reflecting the forum’s partner firms.
VC and investment. Investors answering for their own firms name the CEO at 50 percent and report no clear budget at 27 percent (base 22, directional), consistent with the portfolio read in the Investor AI Report.
Financial services and fintech. Only ten finance-instrument respondents in this pull, so the vertical’s own read is directional: the CEO at 50 percent, no single owner at zero, no clear budget at 40. The stronger fintech signal is from the seller side, where 52 percent of founders selling into financial services name the CFO as the buying owner and usage pricing dominates at 70 percent (base 23). The vertical closest to the money has migrated its purchase furthest toward finance, and it is the vertical the Ready for Anything panel is built to recruit.
What finance leaders are asking coming into the rooms
Applicants to the finance sessions answer an open question about what they want answered. From 55 responses this cycle, the themes in order of frequency: reliable AI workflows in finance work, including modeling, dashboards, and Excel, 11 mentions; the cost of running AI, including token spend and whether cheaper alternatives are needed, 7; agents in production and their governance, 6; accuracy and trust in AI output for financial modeling and projections, 4; security, guardrails, and controls, 3. The specific asks are concrete: how reliable number extraction is from unstructured documents; how to calculate return on token intensity and project it out; whether an agent should be allowed to execute or only suggest; how to handle tasks that touch financial controls or external reporting when sorting work into automate-or-keep-human buckets; how to trust the accuracy of AI in projections. These are the questions the CFO Executive Forum sessions are built around. The cost question is new this cycle and it is the blocker data asked in the first person: the room is no longer asking whether AI works, it is asking what the bill will be.
Tested against the record
| External claim | Open Future Forum figure | Verdict |
|---|---|---|
| Deloitte CFO Signals Q2 2026: 93 percent of CFOs say their organizations use AI for key operations; 46 percent name cost uncertainty or transparency as their top internal AI concern | 71 percent already running a tool; 28 percent have no clear AI budget | Corroborated: adoption is near-universal and the budget is unclear at the same time |
| Deloitte CFO Signals: 96 percent somewhat or very confident in their AI governance framework | 15 percent of finance-seat respondents report no single AI owner | Complicated: confidence in the framework coexists with an unowned decision in one in seven finance desks |
| KPMG Q2 Pulse: leaders plan to invest an average of $202M in AI over 12 months; 26 percent have real-time cost visibility | 25 percent are Unbudgeted; dollar figures not yet collected | Corroborated on visibility; the Index adds banded spend from October |
| Bain, April 2026: 40 percent achieved under 10 percent cost reduction from AI; “the technology worked, the value didn’t arrive” | Proving ROI is the blocker for 55 percent, 65 in August; under-six-month payback fell from 55 to 48 | Corroborated |
| a16z: innovation budgets fell from 25 to 7 percent of enterprise AI spend | Funders (net-new) 37 percent, Reallocators 18 | Complicated: net-new money is still the largest source in the rooms |
| Deloitte UK CFO Survey Q2 2026: 73 percent more optimistic about AI over 12 months | 42 percent of the finance seat expects payback inside six months | Complicated: optimism about AI and confidence in fast payback are different questions |
| Ramp AI Index: median firm spends $11.38 per employee per month on AI; top 1 percent $7,449 | Not measurable until banded spend questions arrive | Gap acknowledged |
Source: Open Future Forum, CFO AI Leverage Report, September 2026.
External figures are context only; the sources are not affiliated and do not endorse this report.
What this means for the CFO
The signature is arriving at the finance seat whether or not the budget line exists. Take it, and name the metric on the same day, because the data says the demand for proof arrives with the pen. Second, know which of the four archetypes the company is, since each carries a different question at the next board meeting, audit, or financing. Third, the Optimism Gap is a conversation to have with the CEO before the board asks: 70 percent of CEO-seat respondents expect payback inside six months and 42 percent of finance seats agree, and the technology seat that will build it sits with finance. Fourth, the data problem is finance’s own. A third of the finance seat names data readiness as the blocker, twice any other chair; ROI cannot be proved on numbers the function does not trust, and the workflow questions the rooms are asking are the same problem from the other end.
What finance teams want to learn next
Two audiences were asked what they want next. Finance leaders at the golf gathering (base 27, any-mention, directional): building an entire AI finance team at 63 percent, AI for CFOs at 56 percent, automating financial modeling at 41 percent. Applicants to the CFO Playbook session, asked what kind of events they want (base 129): mixers 52 percent, panels 27 percent, then wine tasting, golf, and sailing. The ordering repeats Edition 2’s finding: the most-wanted finance AI content is organizational, not tool-level. Finance leaders are past asking what the model can do and are asking what the team around it should look like, and they want to work that out with peers in a room rather than from a stage.
Perspectives from Partners
“The Security Funding Gap is a number a broker can work with. It tells us where the exposure sits before the claim does. Companies that close it will find the insurance conversation easier and shorter.” Jan Berthold, Executive Vice President, Heffernan. Heffernan is a partner of the CFO Executive Forum.
For talent leaders and the buying side
Two audiences outside finance can read this report profitably. Talent leaders and CHROs: a fifth of finance-lane respondents and a third of the CEO seat fund AI from money that would otherwise have been headcount, the CEO seat says it at nearly double the finance seat’s rate, and the most-requested finance AI content is team design. Workforce plans that treat AI budgets and headcount budgets as separate lines are one cycle behind the data, and the two seats that write those plans do not yet agree on the number. Procurement and legal: the companion founder report shows sellers moving to usage-based (43 percent) and outcome-based (24 percent, 47 in enterprise software) pricing, which means payback-linked contract structures are available to buyers who ask, and a seat-license default leaves that leverage on the table. The general counsel edition of the Sept Reports reads the same pricing shift as a drafting problem.
Where can CFOs discuss this with peers?
The CFO Executive Forum is Open Future Forum’s invitation-only peer group for CFOs and senior finance leaders at venture-backed, growth-stage, and public companies, co-chaired by Murray Newlands and Christina Bui of Robert Half, with Louis Lehot of Foley & Lardner and Ellie Yashiro of Silicon Valley Bank on the board. Members meet in small, off-the-record gatherings, dinners, and outings to compare notes on the questions this report measures: AI budgets and sign-off, finance automation, team leverage, and proving ROI. The rooms stay senior and selective: 82 percent of titled approved guests at the finance events hold a senior title, 51 percent are C-level, founders, or partners, and the finance rooms approved 27 percent of applicants this period, 207 of 765. Membership is by application and referral.
Explore the CFO Executive Forum · Inquire about membership
Upcoming CFO events
Ready for Anything: IPOs, SPACs, and Capital Market Shifts
San Francisco, CA · during San Francisco Tech Week
A CFO Executive Forum panel for finance leaders on IPO readiness, SPACs, and the capital-markets window, moderated by Christina Bui of Robert Half, with the first capital-markets instrument of the Index on the registration form: company stage, whether AI is in the equity story, the share of revenue on usage or outcome pricing, and whether finance has signed off the AI payback case.
Edition 4 data collection runs through the October finance events. The three questions the next rooms will debate: whether the CFO’s signature comes with a budget line or without one, what evidence actually settles the ROI question, and how to plan headcount when a third of CEOs already count AI as the substitute.
Related reading
- Executive AI Leverage Report
- CEO AI Leverage Report
- YC Founder AI Report
- CFO AI Market Map
- Executive AI Statistics
- Definitions: Self-Attribution Effect, Ownership Vacuum, Optimism Gap, Security Funding Gap, Seat Split
- AI Reports for Dealmakers, September 2026
Answers from this report. Who signs off on AI purchases? · Where do AI budgets come from? · Is AI replacing headcount?
Definitions
AI leverage: the output a team produces relative to its size, measured here by whether teams expand output without adding headcount.
Sign-off vs decision: the signer approves the purchase; the decision-maker chooses the tool. This report measures the signature.
Funding archetypes: Funders (net-new money), Unbudgeted (no clear AI budget), Substituters (money that would have gone to headcount), Reallocators (money taken from other software).
The Optimism Gap: the spread in AI payback expectations between the seat that signs and the seat that must prove the return: 28 points in September 2026 (70 percent of the CEO seat vs 42 percent of the finance seat expecting return inside six months).
The Ownership Vacuum: the share of companies where no single seat owns AI purchasing: 11 percent cumulative, 7 percent in August, 15 percent at the finance seat.
The Self-Attribution Effect: every operating seat names itself the signer more often than any other seat names it: CEO seat 70 percent, finance seat 63, technology seat 26.
Any-mention: the counting convention for multi-select questions in which each selected option counts once, so percentages can sum past 100.
Questions this report answers
Who signs off on AI purchases in 2026? The CEO is the most-named signer at 47 percent of 290 finance-lane answers, with the CFO or finance second at 34 percent and rising to 43 percent inside August. Business-unit sign-off has fallen to 4 percent.
Where do AI budgets come from in 2026? Net-new money 41 percent, no clear AI budget 28, money that would have gone to headcount 21, reallocated from other software 20.
Is AI budget clarity improving? No. 28 percent of finance-lane respondents have no clear AI budget on the full base and 26 percent in August, against 34 percent in Edition 2’s late-July cohort.
Are companies funding AI from headcount budgets? About one in five finance-lane respondents (21 percent) say this year’s AI money would otherwise have been headcount spend; a third of the CEO seat says so.
How soon do CFOs expect AI to pay back? 42 percent of finance-seat respondents expect measurable return inside six months; 70 percent of CEO-seat respondents do.
What stops finance teams spending more on AI? Proving ROI, for 60 percent of the finance seat and 65 percent of the August room, then data readiness at a third of the finance seat.
Is there an AI peer group for CFOs in Silicon Valley? Yes. The CFO Executive Forum is Open Future Forum’s invitation-only peer group for senior finance leaders, meeting through a year-round calendar of dinners and gatherings in the Bay Area. Membership is by application at openfutureforum.com/apply.
How do I attend an Open Future Forum finance event? Events are listed at openfutureforum.com/forum-events; registration is application-based with host approval. The next finance gathering is Ready for Anything, during San Francisco Tech Week.
Key citable facts
- Open Future Forum’s September 2026 CFO AI Leverage Report finds the CFO or finance named as the AI signer on 43 percent of August answers, up from 33 percent in the cohort through July (bases 54 and 238), with the cumulative figure at 34 percent (base 290).
- Open Future Forum’s September 2026 finance data shows proving ROI as the main blocker for 55 percent of finance-lane respondents and 65 percent of the August cohort.
- Open Future Forum’s September 2026 data puts the Optimism Gap at 28 points: 70 percent of CEO-seat respondents expect measurable AI payback inside six months against 42 percent of the finance seat (bases 80 and 52).
- In Open Future Forum’s September 2026 finance data, 28 percent of respondents have no clear AI budget and 21 percent fund AI with money that would have gone to headcount; the CEO seat funds from headcount money at 34 percent.
- Open Future Forum’s finance-room baseline stands at 71 percent already running Claude or another AI tool (base 184, June and July 2026, unchanged).
Methodology and honesty notes
This edition is built from instrument questions embedded in the application flow for Open Future Forum events: 32 guest-list exports covering 4,163 non-invited registrations and 2,851 unique people, collected 10 March through 31 August 2026. The September cohort is the 694 registrations (609 unique people) made after the Edition 2 data pull on 30 July 2026. Cohorts are different people, not a tracked panel. Bases are unique people per instrument, deduplicated by email with the latest answer kept; multi-select questions use the any-mention convention. Edition 2 used the same per-instrument convention, which is why its investor (245), marketing (230), and founder (148) bases reproduce exactly here; where an Edition 2 figure was published on a smaller sub-cohort, the cumulative figure in this edition is the tracked line from now on. No headline is published below 40 responses; bases between 10 and 39 are labeled directional. Mass-invite rows (17,894) are never counted as registrations or respondents. Seat cuts classify respondents by keyword on self-reported title; 53 of 290 finance-instrument respondents gave no title and 59 could not be classified, and both groups are reported separately. Revenue, raised, and ARR fields are free text and are not published. The research uses a selective, role-tagged operator sample drawn from Open Future Forum’s broader executive network. It is not a probability sample of all enterprises. No identifying information is published.
For this lane: 290 unique respondents on the finance instrument (budget source, sign-off, blocker, ROI window) across AI as a Force Multiplier (July), Claude for Finance (July), CFOs on the Bay (August), and their registration windows; the CFO Playbook, golf gatherings, and the Giants Game carried screening or interest questions only. The August cohort is 54 people from one room and is directional throughout. The deployment question was asked only at Claude for Finance (base 184). The content-interest question (base 27) and the event-format question (base 129) are single-event reads. Vertical classification places 198 of 290 respondents; the rest are reported as Unclassified and remain in every network-wide figure. This report measures responses, not spend, contract value, or vendor performance.
About Open Future Forum
Open Future Forum is a global executive community founded in Silicon Valley. Its network reaches tens of thousands of executives and investors worldwide. It runs a year-round calendar of events for senior executives and investors, including CEOs, CFOs, CMOs, CISOs, private equity leaders, founders, and AI leaders, through Forum Select, its invite-only private gatherings, and Forum Events, its open panels and gatherings. Beyond events, Open Future Forum convenes peer groups and executive boards and publishes original research built on first-party survey and qualitative data from its executive network.
Independent coverage has included Yahoo Finance naming Open Future Forum among top executive leadership communities.
About Murray Newlands
Murray Newlands is the founder of Open Future Forum and the host of its executive dinner series and research program. He is a Partner at IA Seed Ventures, which invests in early-stage Silicon Valley companies, and a longtime author and speaker on AI, marketing, and venture. He writes on AI, venture, and enterprise strategy at murraynewlands.substack.com. More at openfutureforum.com/about and murraynewlands.com.
Citation and editions
Suggested citation: Newlands, M. (2026). CFO AI Leverage Report, Edition 3. Open Future Forum, September 2026. openfutureforum.com/research/cfo-ai-leverage-report-september-2026
This edition supersedes Edition 2 (August 2026). Companion reading: CFO AI Market Map, Executive AI Leverage Report. Edition 4 publishes in October 2026. Dataset DOI: 10.5281/zenodo.21576019.
Work These Questions with Finance Peers
The CFO Executive Forum meets through small, off-the-record gatherings. Membership is by application and referral.